
| 일 | 월 | 화 | 수 | 목 | 금 | 토 |
|---|---|---|---|---|---|---|
| 1 | 2 | 3 | 4 | 5 | ||
| 6 | 7 | 8 | 9 | 10 | 11 | 12 |
| 13 | 14 | 15 | 16 | 17 | 18 | 19 |
| 20 | 21 | 22 | 23 | 24 | 25 | 26 |
| 27 | 28 | 29 | 30 | 31 |
- vm support
- envoy
- kiali
- Jenkins
- K8S
- service mesh
- envoy filter
- WSL
- istio-proxy
- prometheus
- aws eks
- loadbalancer
- vagrant
- istio traffic flow
- Ingress
- Kind
- 엠비언트모드
- argocd
- kmesh
- docker
- CNI
- grafana
- CICD
- 데이터 플레인 확장
- life of packet
- vpc cni
- Ambient
- Observability
- Istio
- Kubernetes
- Today
- Total
WellSpring
AEWS 5주차 - EKS Autoscaling 본문
※ 본 게재 글은 gasida님의 AEWS 강의내용과 실습예제 및 Autoscaling/karpenter 관련 aws 공식사이트와 Blog 등을 참고하여 작성하였습니다.
[ 기본 이론정리 ]
☞ 리소스 부족 대응 기술 : 자원의 임계치 등을 관측하여 Scale-up 또는 Scale-out 의 방향으로 안정적 서비스를 제공할 수 있도록 인프라를 제공함

☞ K8s 의 Auto-Scaling 기법
※ 동일 Cluster 내에서는 HPA 와 VPA 을 병행하여 사용 불가하다!!
1) HPA (Horizontal Pod Auto-scaling)
- 인프라 자원의 임계치를 정해두고, 해당 범위를 벗어나면 자원의 스펙을 업그레이드 하지 않고, HPA controller를 통해 Pod 갯수 자체를 늘려준다.
- 관리 대상 자원은 하기와 같다.
- Deployment
- Replicaset
- StatefulSet
- Recplication Controller

- 주로 사용되는 곳은 하기와 같습니다.
1) 서비스의 빠른 기동을 요구하는 APP 환경
2) Stateless APP
2) VPA (Vertical Pod Auto-scaling)
- 파드의 리소스를 감시하여, 파드의 리소스가 부족한 경우 파드를 Restart하며 파드의 리소스를 증가시키고, 반대로 리소스가 남을 경우 정해진 수순에 따라 리소스를 감소 시킨다. ( Scale-up & Scale-down )

[ 사용 예시 ]
. Stateful APP : 각각 파드를 Restart하고, 자원의 성능만 좋아지기 때문에 각각 파드의 역할은 유지
3) CAS (Cluster Auto-scaler)
- 워커 노드의 자원이 모두 소모된 경우 자원이 더 필요하다고 판단하면 새로운 클러스터를 생성하고, 더 이상 새로운 자원이 필요하지 않게되면 생성된 클러스터를 삭제합니다. 새로운 클러스터를 생성해야하는 경우 기존에 설정한 Cloud Provider에게 요청하여 새로운 노드를 생성하고, 다음 생성할 파드가 해당 노드에도 할당되게 됩니다.

4) Karpenter
- Unscheduled 파드가 있는 경우 새로운 노드 및 파드 Provisioning → 노드 Scale Up/Out

[ 추가 참조 자료 ]
[영상] EKS 오토스케일링* ‘24 - Link
- resource.requestes(CPU,Memory) 설정과 미설정 시 동작

- 수평 확장 Horizontal Scaling
- 운영 환경에 더 많은 워크로드(VM, Task, Pod)를 추가하는 방식
- 트래픽을 여러 워크로드에 분산시키는 방법
- 확장성이 높고 유연한 방법
- 비용 효율적
- Stateless 워크로드에 적합 (데이터 일관성 유지 필요)
- 수직 확장 Vertical Scaling
- 운영 환경의 기존 워크로드의 성능(CPU, Memory)을 향상하는 방법
- 하드웨어는 확장에 한계가 존재함
- 확장 과정에서의 장애 위험이 존재함
- 수평적 확장과 비교하면 유연성이 부족함
- AWS Auto Scaling 정책
- Simple/Step scaling : Manual Reactive, Dynamic scaling
- 고객이 정의한 단계에 따라 메트릭을 모니터링하고 인스턴스를 추가 또는 제거합니다.
- Target tracking : Automated Reactive, Dynamic scaling
- 고객이 정의한 목표 메트릭을 유지하기 위해 자동으로 인스턴스를 추가 또는 제거합니다.
- Scheduled scaling : Manual Proactive
- 고객이 정의한 일정에 따라 인스턴스를 시작하거나 종료합니다.
- Predictive scaling : Automated Proactive
- 과거 트렌드를 기반으로 용량을 선제적으로 시작합니다.
- Simple/Step scaling : Manual Reactive, Dynamic scaling
- K8S Auto Scaling 정책
- 확장 방법 : 컨테이너(파드) vs 노드(서버)
- 컨테이너 수평적 확장
- 컨테이너 수직적 확장
- 노드 수평적 확장
- 노드 수직적 확장
- 확장 기준
- 컨테이너 메트릭 기반
- 애플리케이션 메트릭 기반
- 이벤트(일정, 대기열 등) 기반
- 확장 정책
- 단순 확장 정책
- 단계 확장 정책
- 목표 추적 확장 정책
- 확장 방법 : 컨테이너(파드) vs 노드(서버)
- EKS Auto Scaling - Link
- HPA : 서비스를 처리할 파드 자원이 부족한 경우 신규 파드 Provisioning → 파드 Scale Out
- VPA : 서비스를 처리할 파드 자원이 부족한 경우 파드 교체(자동 or 수동) → 파드 Scale Up
- CAS : 파드를 배포할 노드가 부족한 경우 신규 노드 Provisioning → 노드 Scale Out
- Karpenter : Unscheduled 파드가 있는 경우 새로운 노드 및 파드 Provisioning → 노드 Scale Up/Out
◈ AWS Auto Scaling 한계 → 관리 복잡성 증가, 최적화 설정 어려움, 비용 관리 어려움
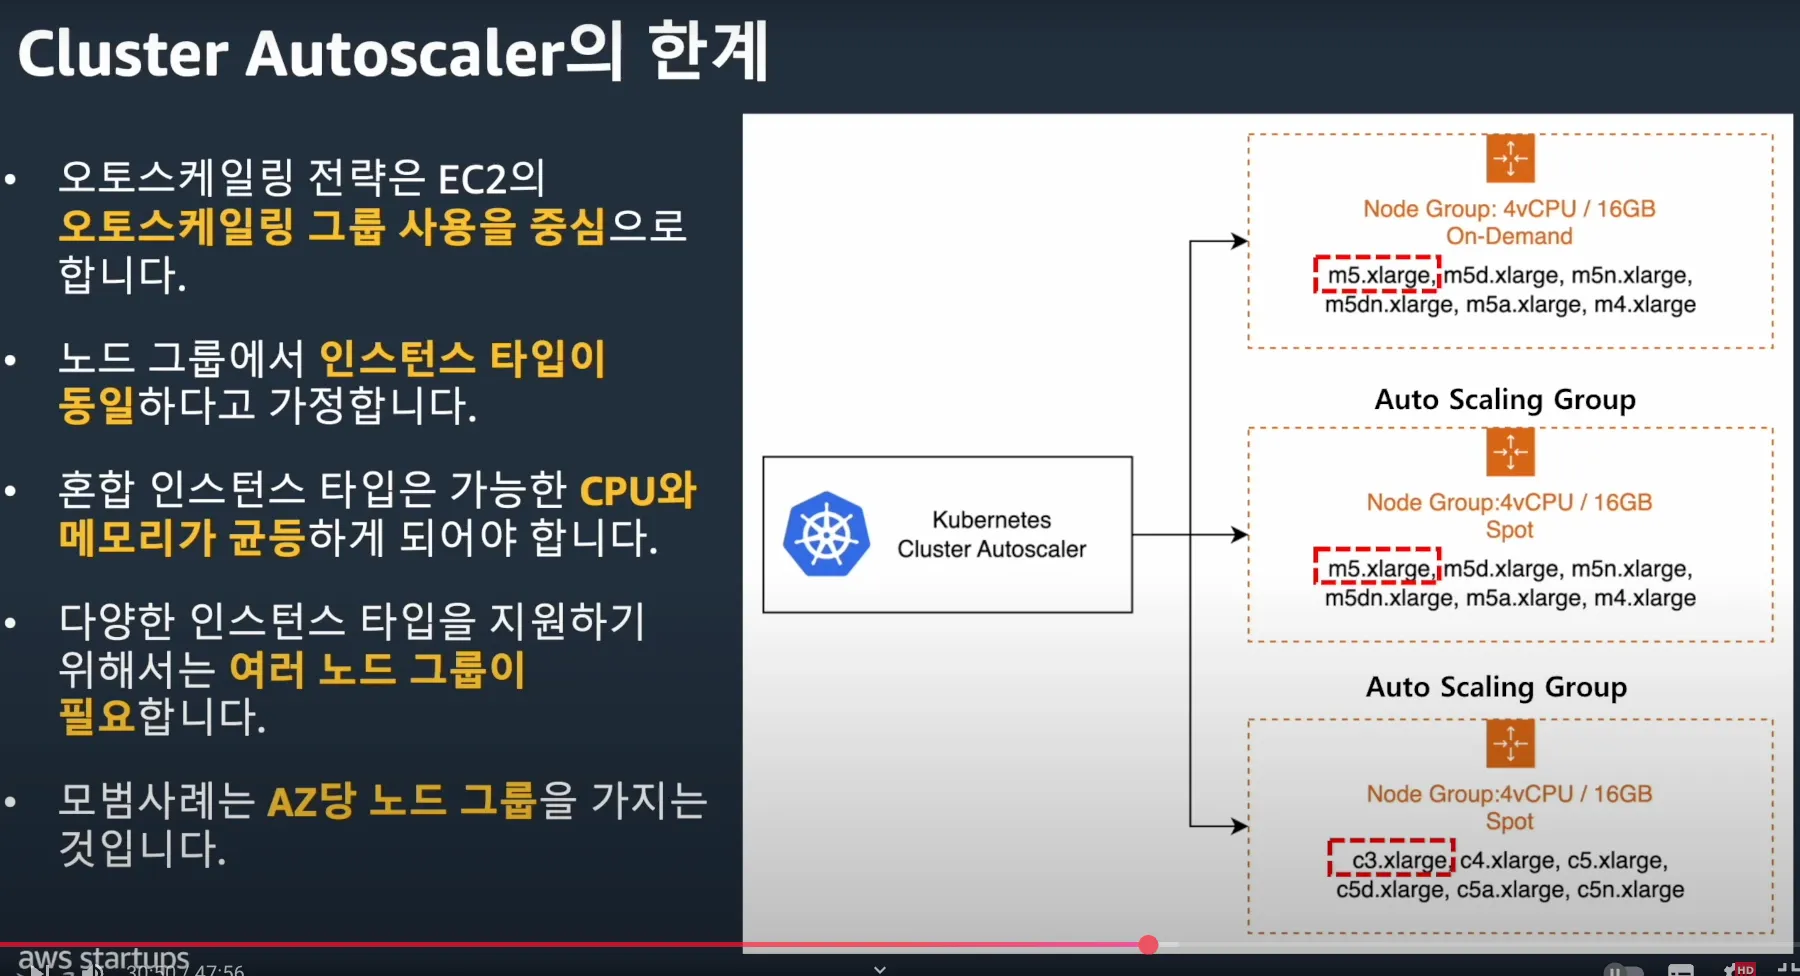
- 오토스케일링 전략은 EC2의 오토스케일링 그룹 사용을 중심으로 동작합니다
- 노드 그룹에서 인스턴스 타입이 동일하다고 가정합니다.
- 혼합 인스턴스 타입은 가능한 CPU와 메모리가 균등하게 되어야 합니다.
- 다양한 인스턴스 타입을 지원하기 위해서는 여러 노드 그룹이 필요합니다.
- 모범사례는 AZ당 노드 그룹을 가지는 것입니다.
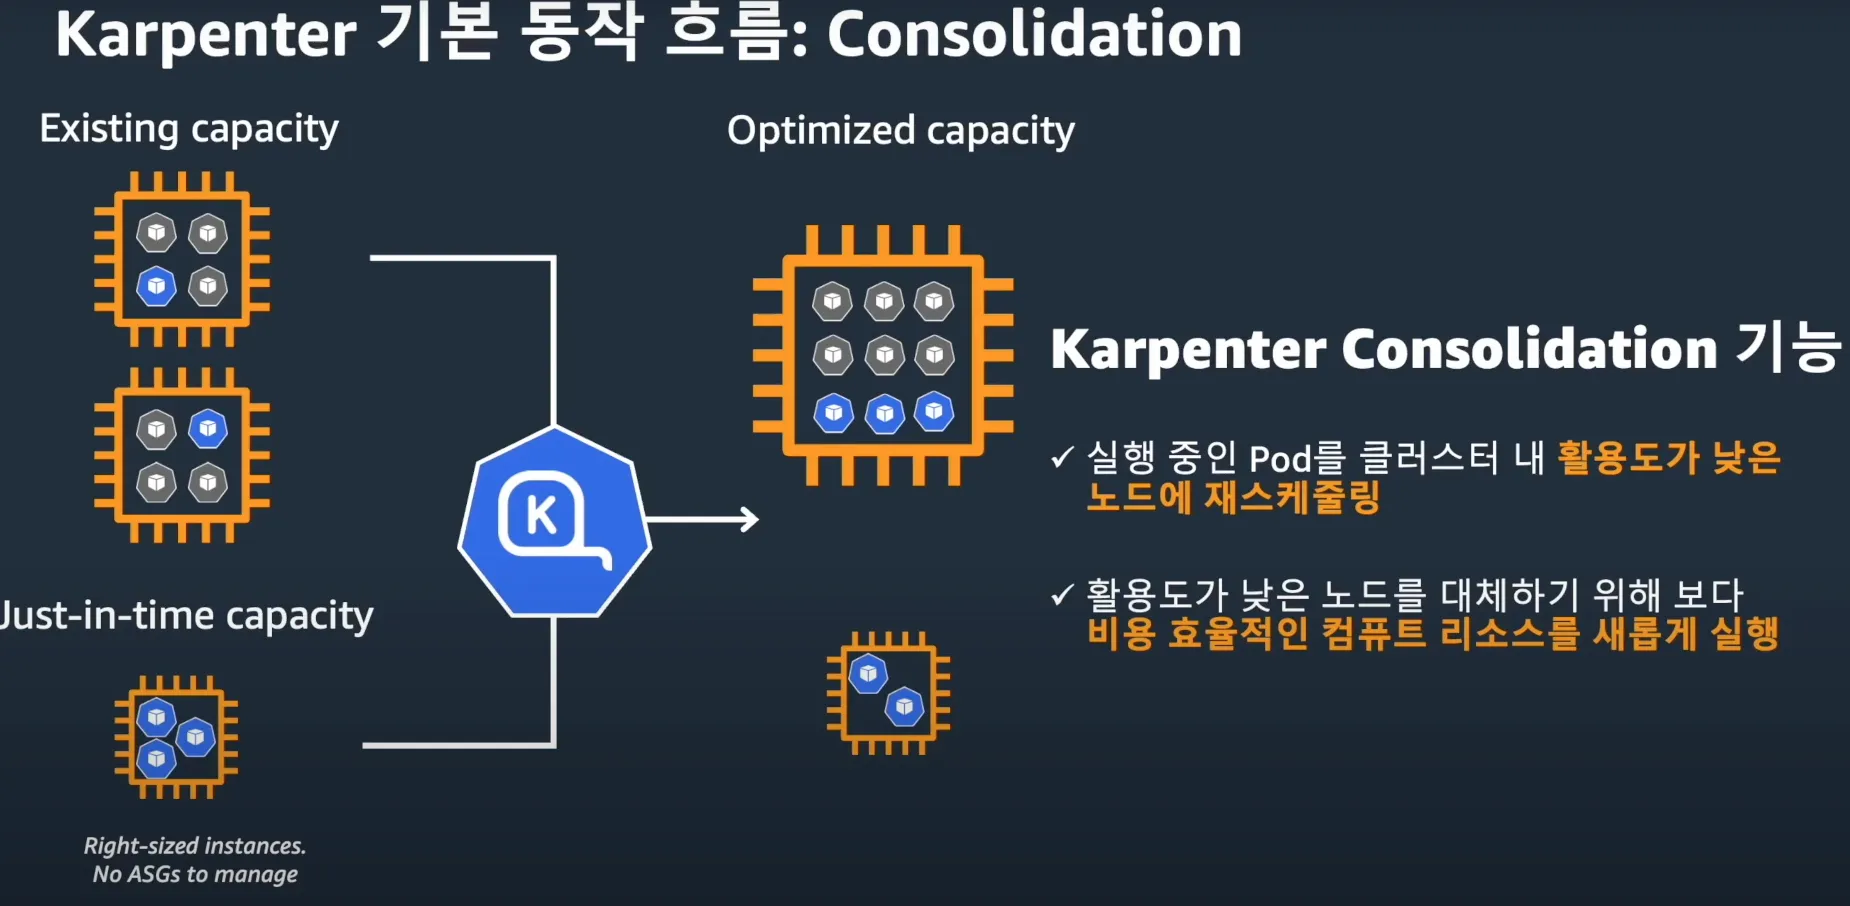
♣ 카펜터 : 유연한 노드 프로비저닝, 빠른 스케일링 및 비용 최적화, 똑똑한 통합 관리 및 간소화된 설정, 향상된 리소스 활용 및 확장성


- EC2와 긴밀히 통합 : EC2 Fleet API, ASGs 가 없음
- 쿠버네티스 네이티브 : Watch API, Labels, Finalizers
- 자동화된 인스턴스 선택 : 워크로드 요구사항을 인스턴스 타입과 일치
- 기본 동작 흐름 : 카펜터가 ‘파드 unschedulable’ 감지 후 Pod 스펙 평가 후 ‘EC2 Fleet’를 통해 노드 프로비저닝
- Over Provisioning : 스파이크 트래픽 대비하기 - 여유 노드를 항상 유지하기, 더미파드 사용(낮은 우선순위 적용)
[ 카펜터의 동작 방식 ]
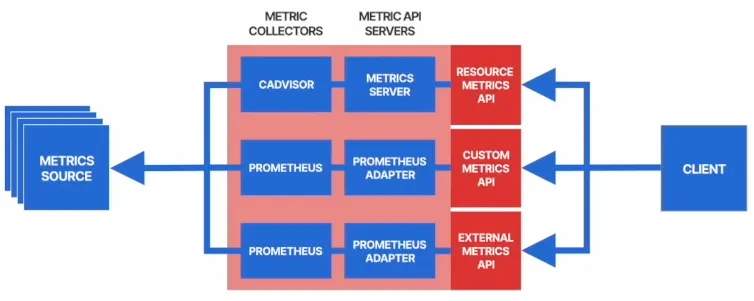
1) 다양한 Metric 활용 : Resource Metric API, Custom Metric API, External Metric API
- Resource Metric API : Node 또는 Pod의 CPU, 메모리 사용량 등의 metric 기반으로한 파드 스케일링, metrics.k8s.io
- Custom Metric API : 사용자가 정의한 클러스터 내부의 metric을 기반으로 파드 스케일링, custom.metrics.k8s.io
- External Metric API : 클러스터 외부에서 수집된 metric 을 기반으로 파드 스케일링, external.metrics.k8s.io
2) KEDA 활용 : 다양한 Event로 Scaling 수행
- 이벤트 기반 파드 오토스케일링 (HPA 이용)
- 트리거 : cron, ..
- ScaledObject 오브젝트에 명세 정의
- 카펜터와 통합되어 클러스터 수준 오토스케일링 지원 : 예) Cron으로 특정 시간에 노드 증설
0. 실습환경 구성
☞ Amazon EKS (myeks) 윈클릭 배포 & 기본 설정
Step1. Amazon EKS (myeks) 윈클릭 배포
# YAML 파일 다운로드
curl -O https://s3.ap-northeast-2.amazonaws.com/cloudformation.cloudneta.net/K8S/myeks-5week.yaml

# 변수 지정
CLUSTER_NAME=myeks
SSHKEYNAME=<SSH 키 페이 이름>
MYACCESSKEY=<IAM Uesr 액세스 키>
MYSECRETKEY=<IAM Uesr 시크릿 키>

# CloudFormation 스택 배포
aws cloudformation deploy --template-file myeks-5week.yaml --stack-name $CLUSTER_NAME --parameter-overrides KeyName=$SSHKEYNAME SgIngressSshCidr=$(curl -s ipinfo.io/ip)/32  MyIamUserAccessKeyID=$MYACCESSKEY MyIamUserSecretAccessKey=$MYSECRETKEY ClusterBaseName=$CLUSTER_NAME --region ap-northeast-2

# CloudFormation 스택 배포 완료 후 작업용 EC2 IP 출력
aws cloudformation describe-stacks --stack-name $CLUSTER_NAME --query 'Stacks[*].Outputs[0].OutputValue' --output text
(옵션) 배포 과정 살펴보기
# 운영서버 EC2 SSH 접속
ssh -i <SSH 키 파일 위치> ec2-user@$(aws cloudformation describe-stacks --stack-name myeks --query 'Stacks[*].Outputs[0].OutputValue' --output text)
ssh -i ~/.ssh/kp-gasida.pem ec2-user@$(aws cloudformation describe-stacks --stack-name myeks --query 'Stacks[*].Outputs[0].OutputValue' --output text)
-------------------------------------------------
#
whoami
pwd

# cloud-init 실행 과정 로그 확인
tail -f /var/log/cloud-init-output.log

# eks 설정 파일 확인
cat myeks.yaml

# cloud-init 정상 완료 후 eksctl 실행 과정 로그 확인
tail -f /root/create-eks.log

#
exit
-------------------------------------------------
Step2. 자신의 PC에서 AWS EKS 설치 확인 ← 스택 생성 시작 후 20분 후 접속 할 것
# 변수 지정
CLUSTER_NAME=myeks-kyukim
SSHKEYNAME=kp-kyukim

#
eksctl get cluster

# kubeconfig 생성
aws sts get-caller-identity --query Arn
aws eks update-kubeconfig --name $CLUSTER_NAME --user-alias <위 출력된 자격증명 사용자>
aws eks update-kubeconfig --name myeks-kyukim --user-alias jk-admin

#
kubectl ns default  ## Windows : kubens default
kubectl get node --label-columns=node.kubernetes.io/instance-type,eks.amazonaws.com/capacityType,topology.kubernetes.io/zone
kubectl get pod -A
kubectl get pdb -n kube-system
- 노드 IP 정보 확인 및 SSH 접속
# EC2 공인 IP 변수 지정
export N1=$(aws ec2 describe-instances --filters "Name=tag:Name,Values=myeks-ng1-Node" "Name=availability-zone,Values=ap-northeast-2a" --query 'Reservations[*].Instances[*].PublicIpAddress' --output text)
export N2=$(aws ec2 describe-instances --filters "Name=tag:Name,Values=myeks-ng1-Node" "Name=availability-zone,Values=ap-northeast-2b" --query 'Reservations[*].Instances[*].PublicIpAddress' --output text)
export N3=$(aws ec2 describe-instances --filters "Name=tag:Name,Values=myeks-ng1-Node" "Name=availability-zone,Values=ap-northeast-2c" --query 'Reservations[*].Instances[*].PublicIpAddress' --output text)
echo $N1, $N2, $N3
# *remoteAccess* 포함된 보안그룹 ID
aws ec2 describe-security-groups --filters "Name=group-name,Values=*remoteAccess*" | jq
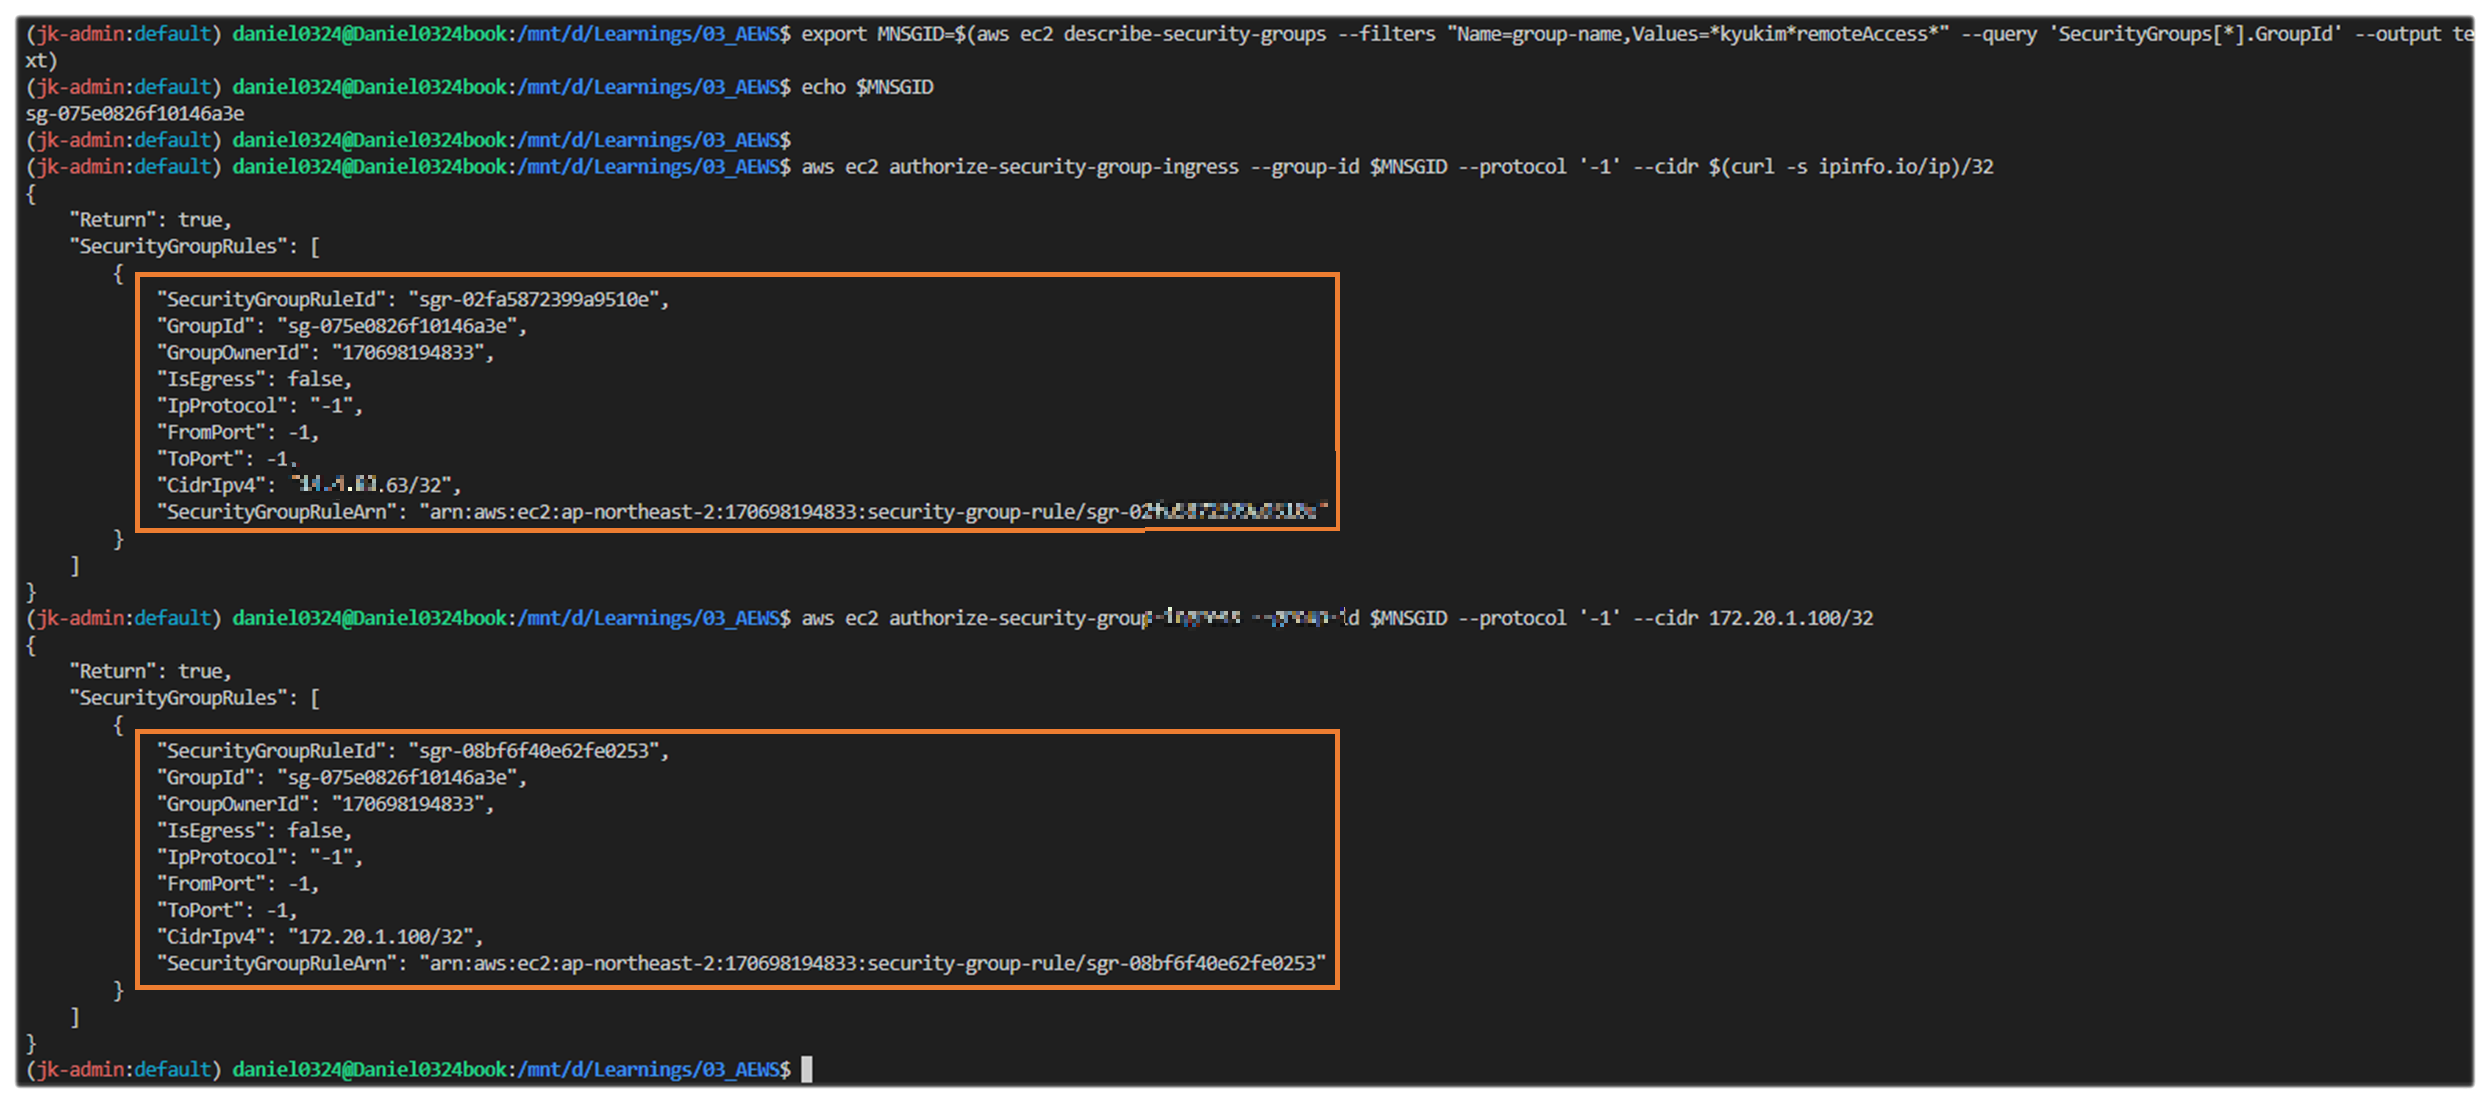
export MNSGID=$(aws ec2 describe-security-groups --filters "Name=group-name,Values=*remoteAccess*" --query 'SecurityGroups[*].GroupId' --output text)
## Mycase :
## export MNSGID=$(aws ec2 describe-security-groups --filters "Name=group-name,Values=*kyukim*remoteAccess*" --query 'SecurityGroups[*].GroupId' --output text)
# 해당 보안그룹 inbound 에 자신의 집 공인 IP 룰 추가
aws ec2 authorize-security-group-ingress --group-id $MNSGID --protocol '-1' --cidr $(curl -s ipinfo.io/ip)/32
# 해당 보안그룹 inbound 에 운영서버 내부 IP 룰 추가
aws ec2 authorize-security-group-ingress --group-id $MNSGID --protocol '-1' --cidr 172.20.1.100/32
# 워커 노드 SSH 접속
for i in $N1 $N2 $N3; do echo ">> node $i <<"; ssh -o StrictHostKeyChecking=no ec2-user@$i hostname; echo; done

- 운영서버 EC2 에 SSH 접속 (SSH 키 파일 사용) : AWS EKS 설치 확인 ← 스택 생성 시작 후 20분 후 접속 할 것
# default 네임스페이스 적용
kubectl ns default

# 환경변수 정보 확인
## export | egrep 'ACCOUNT|AWS_|CLUSTER|KUBERNETES|VPC|Subnet'
export | egrep 'ACCOUNT|AWS_|CLUSTER|KUBERNETES|VPC|Subnet' | egrep -v 'KEY'

# krew 플러그인 확인
kubectl krew list

# 인스턴스 정보 확인
aws ec2 describe-instances --query "Reservations[*].Instances[*].{InstanceID:InstanceId, PublicIPAdd:PublicIpAddress, PrivateIPAdd:PrivateIpAddress, InstanceName:Tags[?Key=='Name']|[0].Value, Status:State.Name}" --filters Name=instance-state-name,Values=running --output table

# 노드 IP 확인 및 PrivateIP 변수 지정
aws ec2 describe-instances --query "Reservations[*].Instances[*].{PublicIPAdd:PublicIpAddress,PrivateIPAdd:PrivateIpAddress,InstanceName:Tags[?Key=='Name']|[0].Value,Status:State.Name}" --filters Name=instance-state-name,Values=running --output table
N1=$(kubectl get node --label-columns=topology.kubernetes.io/zone --selector=topology.kubernetes.io/zone=ap-northeast-2a -o jsonpath={.items[0].status.addresses[0].address})
N2=$(kubectl get node --label-columns=topology.kubernetes.io/zone --selector=topology.kubernetes.io/zone=ap-northeast-2b -o jsonpath={.items[0].status.addresses[0].address})
N3=$(kubectl get node --label-columns=topology.kubernetes.io/zone --selector=topology.kubernetes.io/zone=ap-northeast-2c -o jsonpath={.items[0].status.addresses[0].address})
echo "export N1=$N1" >> /etc/profile
echo "export N2=$N2" >> /etc/profile
echo "export N3=$N3" >> /etc/profile
echo $N1, $N2, $N3

# 노드 IP 로 ping 테스트
for i in $N1 $N2 $N3; do echo ">> node $i <<"; ping -c 1 $i ; echo; done
Step3. EKS 배포 후 실습 편의를 위한 설정 : macOS, Windows(WSL2)
- Windows (WSL2 - Ubuntu) ⇒ 실습 완료 후 삭제 할 것!
# 변수 지정
export CLUSTER_NAME=myeks
export VPCID=$(aws ec2 describe-vpcs --filters "Name=tag:Name,Values=$CLUSTER_NAME-VPC" --query 'Vpcs[*].VpcId' --output text)
export PubSubnet1=$(aws ec2 describe-subnets --filters Name=tag:Name,Values="$CLUSTER_NAME-Vpc1PublicSubnet1" --query "Subnets[0].[SubnetId]" --output text)
export PubSubnet2=$(aws ec2 describe-subnets --filters Name=tag:Name,Values="$CLUSTER_NAME-Vpc1PublicSubnet2" --query "Subnets[0].[SubnetId]" --output text)
export PubSubnet3=$(aws ec2 describe-subnets --filters Name=tag:Name,Values="$CLUSTER_NAME-Vpc1PublicSubnet3" --query "Subnets[0].[SubnetId]" --output text)
export N1=$(aws ec2 describe-instances --filters "Name=tag:Name,Values=$CLUSTER_NAME-ng1-Node" "Name=availability-zone,Values=ap-northeast-2a" --query 'Reservations[*].Instances[*].PublicIpAddress' --output text)
export N2=$(aws ec2 describe-instances --filters "Name=tag:Name,Values=$CLUSTER_NAME-ng1-Node" "Name=availability-zone,Values=ap-northeast-2b" --query 'Reservations[*].Instances[*].PublicIpAddress' --output text)
export N3=$(aws ec2 describe-instances --filters "Name=tag:Name,Values=$CLUSTER_NAME-ng1-Node" "Name=availability-zone,Values=ap-northeast-2c" --query 'Reservations[*].Instances[*].PublicIpAddress' --output text)
export CERT_ARN=$(aws acm list-certificates --query 'CertificateSummaryList[].CertificateArn[]' --output text) #사용 리전의 인증서 ARN 확인
MyDomain=gasida.link # 각자 자신의 도메인 이름 입력
MyDnzHostedZoneId=$(aws route53 list-hosted-zones-by-name --dns-name "$MyDomain." --query "HostedZones[0].Id" --output text)


# 실습 완료 후 삭제 할 것!
cat << EOF >> ~/.bashrc

# eksworkshop
export CLUSTER_NAME=myeks
export VPCID=$(aws ec2 describe-vpcs --filters "Name=tag:Name,Values=$CLUSTER_NAME-VPC" --query 'Vpcs[*].VpcId' --output text)
export PubSubnet1=$(aws ec2 describe-subnets --filters Name=tag:Name,Values="$CLUSTER_NAME-Vpc1PublicSubnet1" --query "Subnets[0].[SubnetId]" --output text)
export PubSubnet2=$(aws ec2 describe-subnets --filters Name=tag:Name,Values="$CLUSTER_NAME-Vpc1PublicSubnet2" --query "Subnets[0].[SubnetId]" --output text)
export PubSubnet3=$(aws ec2 describe-subnets --filters Name=tag:Name,Values="$CLUSTER_NAME-Vpc1PublicSubnet3" --query "Subnets[0].[SubnetId]" --output text)
export N1=$(aws ec2 describe-instances --filters "Name=tag:Name,Values=$CLUSTER_NAME-ng1-Node" "Name=availability-zone,Values=ap-northeast-2a" --query 'Reservations[*].Instances[*].PublicIpAddress' --output text)
export N2=$(aws ec2 describe-instances --filters "Name=tag:Name,Values=$CLUSTER_NAME-ng1-Node" "Name=availability-zone,Values=ap-northeast-2b" --query 'Reservations[*].Instances[*].PublicIpAddress' --output text)
export N3=$(aws ec2 describe-instances --filters "Name=tag:Name,Values=$CLUSTER_NAME-ng1-Node" "Name=availability-zone,Values=ap-northeast-2c" --query 'Reservations[*].Instances[*].PublicIpAddress' --output text)
export CERT_ARN=$(aws acm list-certificates --query 'CertificateSummaryList[].CertificateArn[]' --output text)
MyDomain=gasida.link # 각자 자신의 도메인 이름 입력
MyDnzHostedZoneId=$(aws route53 list-hosted-zones-by-name --dns-name "$MyDomain." --query "HostedZones[0].Id" --output text)
EOF

# [신규 터미널] 확인
echo $CLUSTER_NAME $VPCID $PubSubnet1 $PubSubnet2 $PubSubnet3
echo $N1 $N2 $N3 $MyDomain $MyDnzHostedZoneId
tail -n 15 ~/.bashrc
☞ AWS LoadBalancer Controller, ExternalDNS, gp3 storageclass, kube-ops-view(Ingress) 설치
Step1. 설치
# AWS LoadBalancerController
helm repo add eks https://aws.github.io/eks-charts
helm install aws-load-balancer-controller eks/aws-load-balancer-controller -n kube-system --set clusterName=$CLUSTER_NAME \
  --set serviceAccount.create=false --set serviceAccount.name=aws-load-balancer-controller

# ExternalDNS
echo $MyDomain
curl -s https://raw.githubusercontent.com/gasida/PKOS/main/aews/externaldns.yaml | MyDomain=$MyDomain MyDnzHostedZoneId=$MyDnzHostedZoneId envsubst | kubectl apply -f -

# gp3 스토리지 클래스 생성
cat <<EOF | kubectl apply -f -
kind: StorageClass
apiVersion: storage.k8s.io/v1
metadata:
  name: gp3
  annotations:
    storageclass.kubernetes.io/is-default-class: "true"
allowVolumeExpansion: true
provisioner: ebs.csi.aws.com
volumeBindingMode: WaitForFirstConsumer
parameters:
  type: gp3
  allowAutoIOPSPerGBIncrease: 'true'
  encrypted: 'true'
  fsType: xfs # 기본값이 ext4
EOF
kubectl get sc


# kube-ops-view
helm repo add geek-cookbook https://geek-cookbook.github.io/charts/
helm install kube-ops-view geek-cookbook/kube-ops-view --version 1.2.2 --set service.main.type=ClusterIP  --set env.TZ="Asia/Seoul" --namespace kube-system

# kubeopsview 용 Ingress 설정 : group 설정으로 1대의 ALB를 여러개의 ingress 에서 공용 사용
echo $CERT_ARN
cat <<EOF | kubectl apply -f -
apiVersion: networking.k8s.io/v1
kind: Ingress
metadata:
  annotations:
    alb.ingress.kubernetes.io/certificate-arn: $CERT_ARN
    alb.ingress.kubernetes.io/group.name: study
    alb.ingress.kubernetes.io/listen-ports: '[{"HTTPS":443}, {"HTTP":80}]'
    alb.ingress.kubernetes.io/load-balancer-name: $CLUSTER_NAME-ingress-alb
    alb.ingress.kubernetes.io/scheme: internet-facing
    alb.ingress.kubernetes.io/ssl-redirect: "443"
    alb.ingress.kubernetes.io/success-codes: 200-399
    alb.ingress.kubernetes.io/target-type: ip
  labels:
    app.kubernetes.io/name: kubeopsview
  name: kubeopsview
  namespace: kube-system
spec:
  ingressClassName: alb
  rules:
  - host: kubeopsview.$MyDomain
    http:
      paths:
      - backend:
          service:
            name: kube-ops-view
            port:
              number: 8080  # name: http
        path: /
        pathType: Prefix
EOF
Step2. 확인
# 설치된 파드 정보 확인
kubectl get pods -n kube-system

# service, ep, ingress 확인
kubectl get ingress,svc,ep -n kube-system

# Kube Ops View 접속 정보 확인 : 조금 오래 기다리면 접속됨...
echo -e "Kube Ops View URL = https://kubeopsview.$MyDomain/#scale=1.5"
open "https://kubeopsview.$MyDomain/#scale=1.5" # macOS
[ 설치 결과 확인 ]


☞ 프로메테우스 & 그라파나(admin / prom-operator) 설치 : 대시보드 Import 17900 - Link
※ 주의 : Annotation 에서 alb.ingress.kubernetes.io/load-balancer-name 은 자신의 자원명에 맞게 수정할 것!!
( In my case, alb.ingress.kubernetes.io/load-balancer-name= myeks-kyukim-ingress-alb )
# repo 추가
helm repo add prometheus-community https://prometheus-community.github.io/helm-charts

# 파라미터 파일 생성 : PV/PVC(AWS EBS) 삭제에 불편하니, 4주차 실습과 다르게 PV/PVC 미사용
cat <<EOT > monitor-values.yaml
prometheus:
  prometheusSpec:
    scrapeInterval: "15s"
    evaluationInterval: "15s"
    podMonitorSelectorNilUsesHelmValues: false
    serviceMonitorSelectorNilUsesHelmValues: false
    retention: 5d
    retentionSize: "10GiB"

  # Enable vertical pod autoscaler support for prometheus-operator
  verticalPodAutoscaler:
    enabled: true

  ingress:
    enabled: true
    ingressClassName: alb
    hosts:
      - prometheus.$MyDomain
    paths:
      - /*
    annotations:
      alb.ingress.kubernetes.io/scheme: internet-facing
      alb.ingress.kubernetes.io/target-type: ip
      alb.ingress.kubernetes.io/listen-ports: '[{"HTTPS":443}, {"HTTP":80}]'
      alb.ingress.kubernetes.io/certificate-arn: $CERT_ARN
      alb.ingress.kubernetes.io/success-codes: 200-399
      alb.ingress.kubernetes.io/load-balancer-name: myeks-kyukim-ingress-alb
      alb.ingress.kubernetes.io/group.name: study
      alb.ingress.kubernetes.io/ssl-redirect: '443'

grafana:
  defaultDashboardsTimezone: Asia/Seoul
  adminPassword: prom-operator
  defaultDashboardsEnabled: false

  ingress:
    enabled: true
    ingressClassName: alb
    hosts:
      - grafana.$MyDomain
    paths:
      - /*
    annotations:
      alb.ingress.kubernetes.io/scheme: internet-facing
      alb.ingress.kubernetes.io/target-type: ip
      alb.ingress.kubernetes.io/listen-ports: '[{"HTTPS":443}, {"HTTP":80}]'
      alb.ingress.kubernetes.io/certificate-arn: $CERT_ARN
      alb.ingress.kubernetes.io/success-codes: 200-399
      alb.ingress.kubernetes.io/load-balancer-name: myeks-kyukim-ingress-alb
      alb.ingress.kubernetes.io/group.name: study
      alb.ingress.kubernetes.io/ssl-redirect: '443'

kube-state-metrics:
  rbac:
    extraRules:
      - apiGroups: ["autoscaling.k8s.io"]
        resources: ["verticalpodautoscalers"]
        verbs: ["list", "watch"]
  customResourceState:
    enabled: true
    config:
      kind: CustomResourceStateMetrics
      spec:
        resources:
          - groupVersionKind:
              group: autoscaling.k8s.io
              kind: "VerticalPodAutoscaler"
              version: "v1"
            labelsFromPath:
              verticalpodautoscaler: [metadata, name]
              namespace: [metadata, namespace]
              target_api_version: [apiVersion]
              target_kind: [spec, targetRef, kind]
              target_name: [spec, targetRef, name]
            metrics:
              - name: "vpa_containerrecommendations_target"
                help: "VPA container recommendations for memory."
                each:
                  type: Gauge
                  gauge:
                    path: [status, recommendation, containerRecommendations]
                    valueFrom: [target, memory]
                    labelsFromPath:
                      container: [containerName]
                commonLabels:
                  resource: "memory"
                  unit: "byte"
              - name: "vpa_containerrecommendations_target"
                help: "VPA container recommendations for cpu."
                each:
                  type: Gauge
                  gauge:
                    path: [status, recommendation, containerRecommendations]
                    valueFrom: [target, cpu]
                    labelsFromPath:
                      container: [containerName]
                commonLabels:
                  resource: "cpu"
                  unit: "core"
  selfMonitor:
    enabled: true

alertmanager:
  enabled: false
defaultRules:
  create: false
kubeControllerManager:
  enabled: false
kubeEtcd:
  enabled: false
kubeScheduler:
  enabled: false
prometheus-windows-exporter:
  prometheus:
    monitor:
      enabled: false
EOT
cat monitor-values.yaml

# helm 배포
helm install kube-prometheus-stack prometheus-community/kube-prometheus-stack --version 69.3.1 \
-f monitor-values.yaml --create-namespace --namespace monitoring

# helm 확인
helm get values -n monitoring kube-prometheus-stack

# PV 사용하지 않음
kubectl get pv,pvc -A
kubectl df-pv

# 프로메테우스 웹 접속
echo -e "https://prometheus.$MyDomain"
open "https://prometheus.$MyDomain" # macOS

# 그라파나 웹 접속 : admin / prom-operator
echo -e "https://grafana.$MyDomain"
open "https://grafana.$MyDomain" # macOS

#
kubectl get targetgroupbindings.elbv2.k8s.aws -A


# 상세 확인
kubectl get pod -n monitoring -l app.kubernetes.io/name=kube-state-metrics
kubectl describe pod -n monitoring -l app.kubernetes.io/name=kube-state-metrics
...
Service Account:  kube-prometheus-stack-kube-state-metrics
...
    Args:
      --port=8080
      --resources=certificatesigningrequests,configmaps,cronjobs,daemonsets,deployments,endpoints,horizontalpodautoscalers,ingresses,jobs,leases,limitranges,mutatingwebhookconfigurations,namespaces,networkpolicies,nodes,persistentvolumeclaims,persistentvolumes,poddisruptionbudgets,pods,replicasets,replicationcontrollers,resourcequotas,secrets,services,statefulsets,storageclasses,validatingwebhookconfigurations,volumeattachments
      --custom-resource-state-config-file=/etc/customresourcestate/config.yaml
    ...
Volumes:
  customresourcestate-config:
    Type:      ConfigMap (a volume populated by a ConfigMap)
    Name:      kube-prometheus-stack-kube-state-metrics-customresourcestate-config
    Optional:  false
...

kubectl describe cm -n monitoring kube-prometheus-stack-kube-state-metrics-customresourcestate-config
...

#
kubectl get clusterrole kube-prometheus-stack-kube-state-metrics
kubectl describe clusterrole kube-prometheus-stack-kube-state-metrics
kubectl describe clusterrole kube-prometheus-stack-kube-state-metrics | grep verticalpodautoscalers
  verticalpodautoscalers.autoscaling.k8s.io                     []                 []              [list watch]
(옵션) 4주차 노션 확인하여 17900 대시보드에 PromQL/Variables 수정 해둘 것 - Link
[1 Kubernetes All-in-one Cluster Monitoring KR] Dashboard → New → Import → 17900 입력 후 Load ⇒ 데이터소스(Prometheus 선택) 후 Import 클릭
☞ TASK1 : 해당 패널에서 Edit → 아래 수정 쿼리 입력 후 Run queries 클릭 → 상단 Save 후 Apply
# 수정 : CPU 점유율
sum by (instance) (irate(node_cpu_seconds_total{mode!~"guest.*|idle|iowait", instance="$instance"}[5m]))
# 수정 : 메모리 점유율
(node_memory_MemTotal_bytes{instance="$instance"}-node_memory_MemAvailable_bytes{instance="$instance"})/node_memory_MemTotal_bytes{instance="$instance"}
# 수정 : 디스크 사용률
sum(node_filesystem_size_bytes{instance="$instance"} - node_filesystem_avail_bytes{instance="$instance"}) by (instance) / sum(node_filesystem_size_bytes{instance="$instance"}) by (instance)
======================================================================
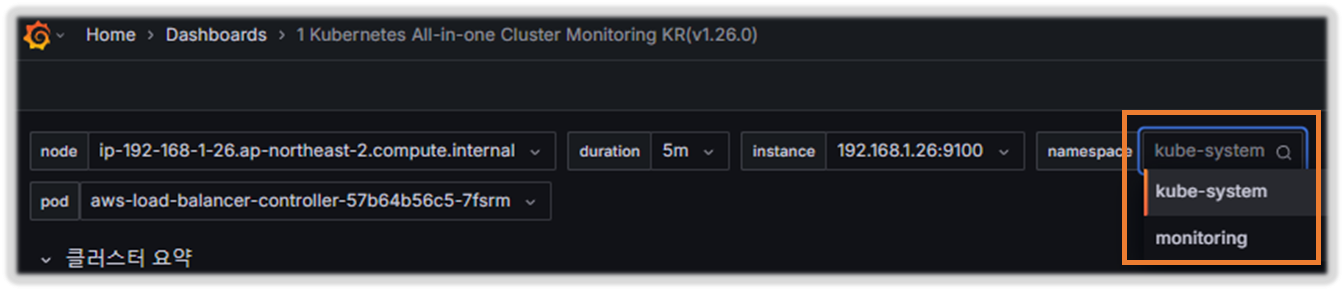
☞ TASK2 : 상단 네임스페이스와 파드 정보 필터링 출력되게 수정해보자!
1) 오른쪽 상단 Edit → Settings → Variables 아래 namesapce, pod 값 수정 ⇒ 수정 후 Save dashboard 클릭
2) namespace 경우 : kube_pod_info 로 수정
3) namespace 오른쪽 Showing usages for 클릭 시 → 맨 하단에 pod variable 가 namespace 를 하위 종속관계 확인
======================================================================
☞ TASK3 : POD의 리소스 할당 제한 표기오류 Fix 해 보자!!
1) 리소스 할당 제한 패널 edit → Save dashboard
sum(kube_pod_container_resource_limits{resource="cpu", pod="$pod"})
2) Memory 수정
sum(kube_pod_container_resource_limits{resource="memory", pod="$pod"})
[ 실행 결과 - 한 눈에 보기 ]


참고 - helm 설치 & 삭제 : https://daniel00324.tistory.com/27
# helm 삭제
helm uninstall -n monitoring kube-prometheus-stack

# crd 삭제
kubectl delete crd alertmanagerconfigs.monitoring.coreos.com
kubectl delete crd alertmanagers.monitoring.coreos.com
kubectl delete crd podmonitors.monitoring.coreos.com
kubectl delete crd probes.monitoring.coreos.com
kubectl delete crd prometheuses.monitoring.coreos.com
kubectl delete crd prometheusrules.monitoring.coreos.com
kubectl delete crd servicemonitors.monitoring.coreos.com
kubectl delete crd thanosrulers.monitoring.coreos.com
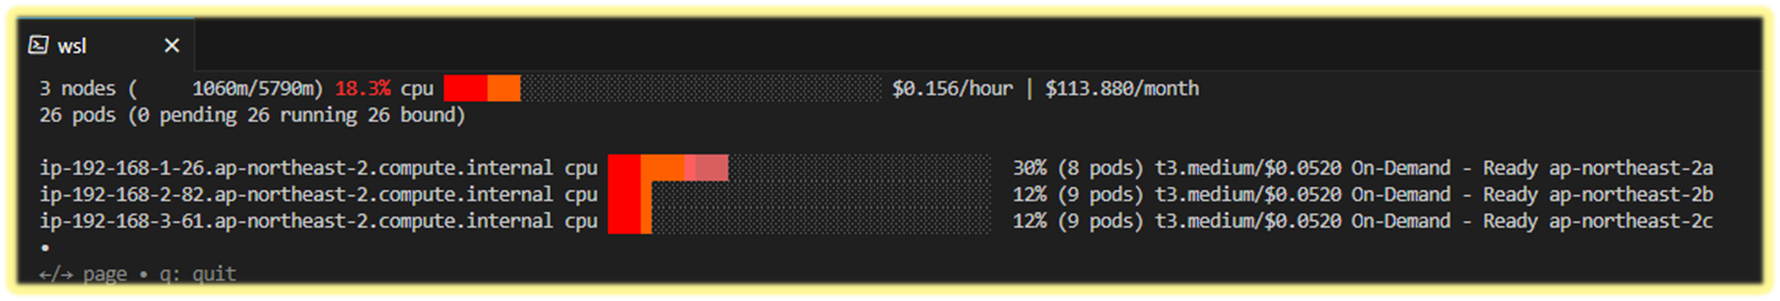
☞ EKS Node Viewer : 노드 할당 가능 용량과 요청 request 리소스 표시, 실제 파드 리소스 사용량 X - 링크
1. 동작
- It displays the scheduled pod resource requests vs the allocatable capacity on the node.
- It does not look at the actual pod resource usage.
- Node마다 할당 가능한 용량과 스케줄링된 POD(컨테이너)의 Resource 중 request 값을 표시한다.
- 실제 POD(컨테이너) 리소스 사용량은 아니다. /pkg/model/pod.go 파일을 보면 컨테이너의 request 합을 반환하며, init containers는 미포함
▶ https://github.com/awslabs/eks-node-viewer/blob/main/pkg/model/pod.go#L82
// Requested returns the sum of the resources requested by the pod. This doesn't include any init containers as we
// are interested in the steady state usage of the pod
func (p *Pod) Requested() v1.ResourceList {
	p.mu.RLock()
	defer p.mu.RUnlock()
	requested := v1.ResourceList{}
	for _, c := range p.pod.Spec.Containers {
		for rn, q := range c.Resources.Requests {
			existing := requested[rn]
			existing.Add(q)
			requested[rn] = existing
		}
	}
	requested[v1.ResourcePods] = resource.MustParse("1")
	return requested
}
2. 설치
# macOS 설치
brew tap aws/tap
brew install eks-node-viewer

# 운영서버 EC2에 설치 : userdata 통해 이미 설치 되어 있음
yum install golang -y
go install github.com/awslabs/eks-node-viewer/cmd/eks-node-viewer@latest  # 설치 시 2~3분 정도 소요

# Windows 에 WSL2 (Ubuntu) 설치
sudo apt install golang-go
go install github.com/awslabs/eks-node-viewer/cmd/eks-node-viewer@latest  # 설치 시 2~3분 정도 소요
echo 'export PATH="$PATH:/root/go/bin"' >> /etc/profile
3. 확인
# Standard usage
eks-node-viewer

# Display both CPU and Memory Usage
eks-node-viewer --resources cpu,memory
eks-node-viewer --resources cpu,memory --extra-labels eks-node-viewer/node-age

# Display extra labels, i.e. AZ : node 에 labels 사용 가능
eks-node-viewer --extra-labels topology.kubernetes.io/zone
eks-node-viewer --extra-labels kubernetes.io/arch

# Sort by CPU usage in descending order
eks-node-viewer --node-sort=eks-node-viewer/node-cpu-usage=dsc

# Karenter nodes only
eks-node-viewer --node-selector "karpenter.sh/provisioner-name"

# Specify a particular AWS profile and region
AWS_PROFILE=myprofile AWS_REGION=us-west-2


Computed Labels : --extra-labels
# eks-node-viewer/node-age - Age of the node
eks-node-viewer --extra-labels eks-node-viewer/node-age
eks-node-viewer --extra-labels topology.kubernetes.io/zone,eks-node-viewer/node-age

# eks-node-viewer/node-ephemeral-storage-usage - Ephemeral Storage usage (requests)
eks-node-viewer --extra-labels eks-node-viewer/node-ephemeral-storage-usage

# eks-node-viewer/node-cpu-usage - CPU usage (requests)
eks-node-viewer --extra-labels eks-node-viewer/node-cpu-usage

# eks-node-viewer/node-memory-usage - Memory usage (requests)
eks-node-viewer --extra-labels eks-node-viewer/node-memory-usage

# eks-node-viewer/node-pods-usage - Pod usage (requests)
eks-node-viewer --extra-labels eks-node-viewer/node-pods-usage
1. HPA - Horizontal Pod Autoscaler
☞ HPA란?
HPA(HorizontalPodAutoscaler)는 CPU, Memory 등 리소스에 임계치를 정의하여, 범위를 초과할 경우 자동으로 스케일 아웃(Pod의 리소스를 증가 시키지 않고, Pod 개수 자체를 늘려줌) 해주는 기능을 HPA 컨트롤러가 리소스를 체크하며 정해둔 replicas 수에 맞춰 Pod를 줄이거나 늘려줍니다.
▶ 실습 : kube-ops-view 와 그라파나(22128 , 22251)에서 모니터링 - Docs , K8S , AWS
Step0. 그라파나(22128 , 22251) 대시보드 Import 설정
Step1. 샘플 애플리케이션 배포
☞ (참고) hpa-example : Dockerfile , index.php (CPU 과부하 연산 수행 , 100만번 덧셈 수행)
# Run and expose php-apache server
cat << EOF > php-apache.yaml
apiVersion: apps/v1
kind: Deployment
metadata:
  name: php-apache
spec:
  selector:
    matchLabels:
      run: php-apache
  template:
    metadata:
      labels:
        run: php-apache
    spec:
      containers:
      - name: php-apache
        image: registry.k8s.io/hpa-example
        ports:
        - containerPort: 80
        resources:
          limits:
            cpu: 500m
          requests:
            cpu: 200m
---
apiVersion: v1
kind: Service
metadata:
  name: php-apache
  labels:
    run: php-apache
spec:
  ports:
  - port: 80
  selector:
    run: php-apache
EOF
kubectl apply -f php-apache.yaml

# 확인
kubectl exec -it deploy/php-apache -- cat /var/www/html/index.php
...

# 모니터링 : 터미널2개 사용
watch -d 'kubectl get hpa,pod;echo;kubectl top pod;echo;kubectl top node'
kubectl exec -it deploy/php-apache -- top

# [운영서버 EC2] 파드IP로 직접 접속
PODIP=$(kubectl get pod -l run=php-apache -o jsonpath="{.items[0].status.podIP}")
curl -s $PODIP; echo
Step2. HPA 정책 생성 및 부하 발생 후 오토 스케일링 테스트 : 증가 시 기본 대기 시간(30초), 감소 시 기본 대기 시간(5분) → 조정 가능
# Create the HorizontalPodAutoscaler : requests.cpu=200m - 알고리즘
# Since each pod requests 200 milli-cores by kubectl run, this means an average CPU usage of 100 milli-cores.
cat <<EOF | kubectl apply -f -
apiVersion: autoscaling/v2
kind: HorizontalPodAutoscaler
metadata:
  name: php-apache
spec:
  scaleTargetRef:
    apiVersion: apps/v1
    kind: Deployment
    name: php-apache
  minReplicas: 1
  maxReplicas: 10
  metrics:
  - type: Resource
    resource:
      name: cpu
      target:
        averageUtilization: 50
        type: Utilization
EOF
혹은
kubectl autoscale deployment php-apache --cpu-percent=50 --min=1 --max=10


# 확인
kubectl describe hpa
...
Metrics:                                               ( current / target )
  resource cpu on pods  (as a percentage of request):  0% (1m) / 50%
Min replicas:                                          1
Max replicas:                                          10
Deployment pods:                                       1 current / 1 desired
...

# HPA 설정 확인
kubectl get hpa php-apache -o yaml | kubectl neat
spec:
  minReplicas: 1               # [4] 또는 최소 1개까지 줄어들 수도 있습니다
  maxReplicas: 10              # [3] 포드를 최대 10개까지 늘립니다
  scaleTargetRef:
    apiVersion: apps/v1
    kind: Deployment
    name: php-apache           # [1] php-apache 의 자원 사용량에서
  metrics:
  - type: Resource
    resource:
      name: cpu
      target:
        type: Utilization
        averageUtilization: 50  # [2] CPU 활용률이 50% 이상인 경우

# 반복 접속 1 (파드1 IP로 접속) >> 증가 확인 후 중지
while true;do curl -s $PODIP; sleep 0.5; done

# 반복 접속 2 (서비스명 도메인으로 파드들 분산 접속) >> 증가 확인(몇개까지 증가되는가? 그 이유는?) 후 중지
## >> [scale back down] 중지 5분 후 파드 갯수 감소 확인
# Run this in a separate terminal
# so that the load generation continues and you can carry on with the rest of the steps
kubectl run -i --tty load-generator --rm --image=busybox:1.28 --restart=Never -- /bin/sh -c "while sleep 0.01; do wget -q -O- http://php-apache; done"


# Horizontal Pod Autoscaler Status Conditions
kubectl describe hpa
...
Events:
  Type    Reason             Age    From                       Message
  ----    ------             ----   ----                       -------
  Normal  SuccessfulRescale  13m    horizontal-pod-autoscaler  New size: 2; reason: cpu resource utilization (percentage of request) above target
  Normal  SuccessfulRescale  11m    horizontal-pod-autoscaler  New size: 3; reason: cpu resource utilization (percentage of request) above target
  Normal  SuccessfulRescale  11m    horizontal-pod-autoscaler  New size: 6; reason: cpu resource utilization (percentage of request) above target
  Normal  SuccessfulRescale  10m    horizontal-pod-autoscaler  New size: 8; reason: cpu resource utilization (percentage of request) above target
  Normal  SuccessfulRescale  5m35s  horizontal-pod-autoscaler  New size: 7; reason: All metrics below target
  Normal  SuccessfulRescale  4m35s  horizontal-pod-autoscaler  New size: 5; reason: All metrics below target
  Normal  SuccessfulRescale  4m5s   horizontal-pod-autoscaler  New size: 2; reason: All metrics below target
  Normal  SuccessfulRescale  3m50s  horizontal-pod-autoscaler  New size: 1; reason: All metrics below target
[ 실행 결과 - 부하 입력 후 replicas 수 모니터링 확인 ]


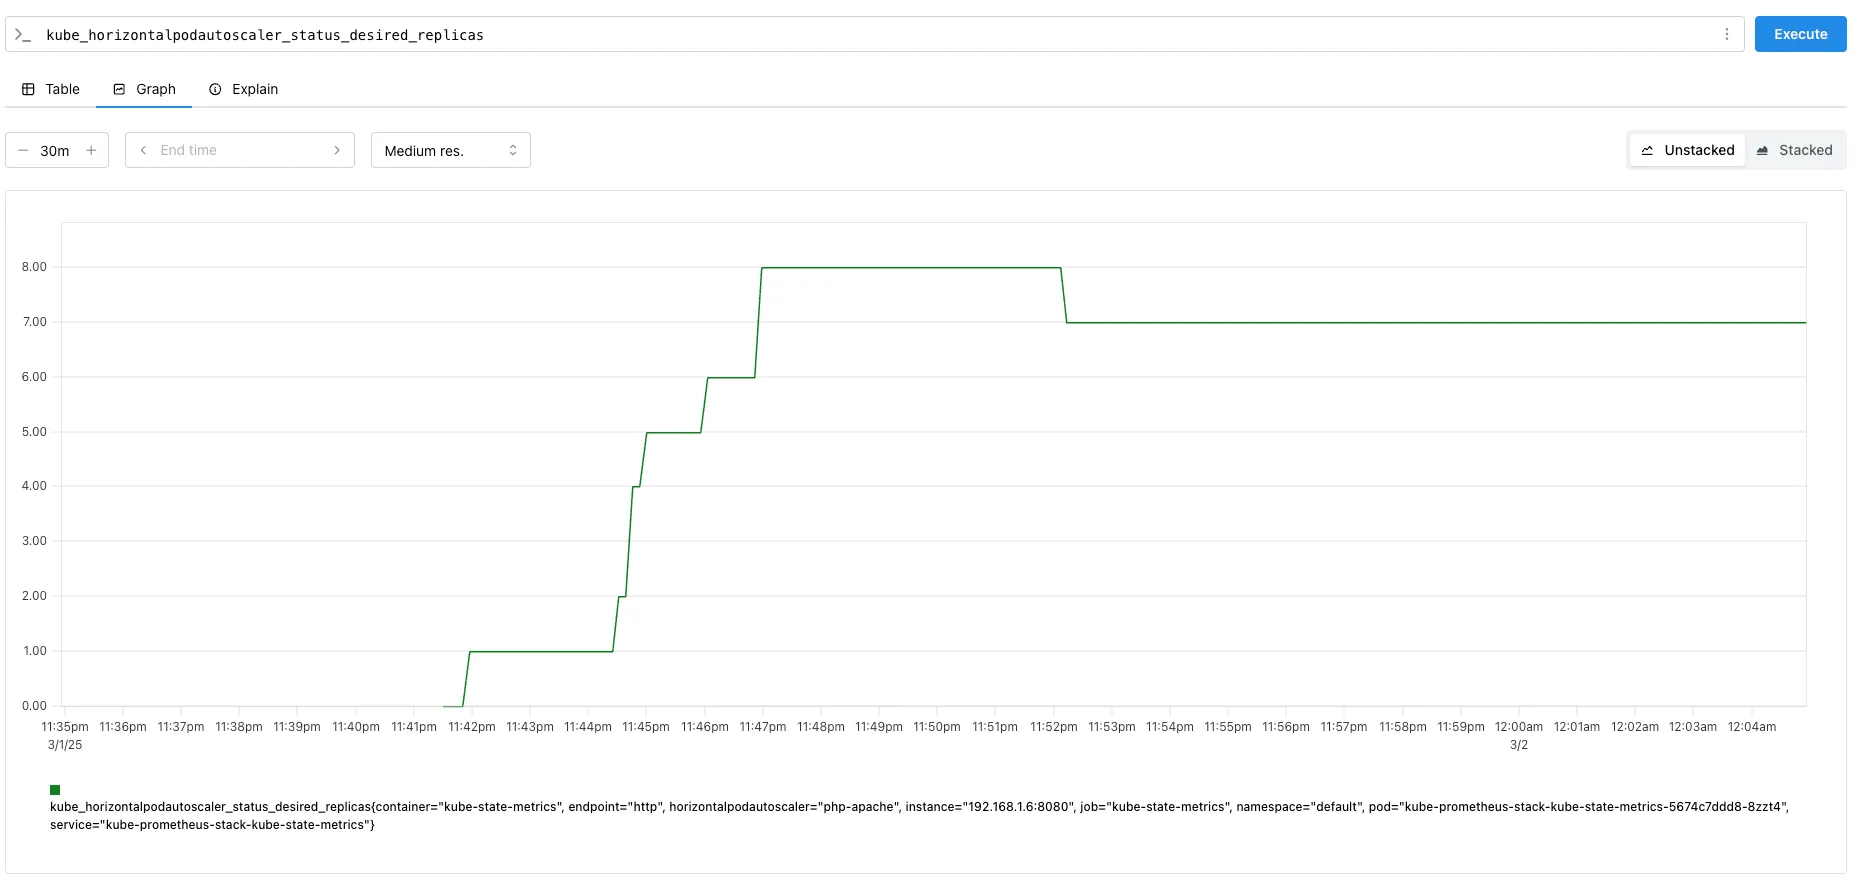
Step3. HPA 프로메테우스 메트릭
kube_horizontalpodautoscaler_status_current_replicas
kube_horizontalpodautoscaler_status_desired_replicas
kube_horizontalpodautoscaler_status_target_metric
kube_horizontalpodautoscaler_status_condition

kube_horizontalpodautoscaler_spec_target_metric
kube_horizontalpodautoscaler_spec_min_replicas
kube_horizontalpodautoscaler_spec_max_replicas

# [운영서버 EC2]
kubectl get pod -n monitoring -l app.kubernetes.io/name=kube-state-metrics -owide
kubectl get pod -n monitoring -l app.kubernetes.io/name=kube-state-metrics -o jsonpath="{.items[*].status.podIP}"
PODIP=$(kubectl get pod -n monitoring -l app.kubernetes.io/name=kube-state-metrics -o jsonpath="{.items[*].status.podIP}")
curl -s http://$PODIP:8080/metrics | grep -i horizontalpodautoscaler | grep HELP
# HELP kube_horizontalpodautoscaler_info Information about this autoscaler.
# HELP kube_horizontalpodautoscaler_metadata_generation [STABLE] The generation observed by the HorizontalPodAutoscaler controller.
# HELP kube_horizontalpodautoscaler_spec_max_replicas [STABLE] Upper limit for the number of pods that can be set by the autoscaler; cannot be smaller than MinReplicas.
# HELP kube_horizontalpodautoscaler_spec_min_replicas [STABLE] Lower limit for the number of pods that can be set by the autoscaler, default 1.
# HELP kube_horizontalpodautoscaler_spec_target_metric The metric specifications used by this autoscaler when calculating the desired replica count.
# HELP kube_horizontalpodautoscaler_status_target_metric The current metric status used by this autoscaler when calculating the desired replica count.
# HELP kube_horizontalpodautoscaler_status_current_replicas [STABLE] Current number of replicas of pods managed by this autoscaler.
# HELP kube_horizontalpodautoscaler_status_desired_replicas [STABLE] Desired number of replicas of pods managed by this autoscaler.
# HELP kube_horizontalpodautoscaler_annotations Kubernetes annotations converted to Prometheus labels.
# HELP kube_horizontalpodautoscaler_labels [STABLE] Kubernetes labels converted to Prometheus labels.
# HELP kube_horizontalpodautoscaler_status_condition [STABLE] The condition of this autoscaler.

curl -s http://$PODIP:8080/metrics | grep -i horizontalpodautoscaler
...
Step4. 자원 정리
kubectl delete deploy,svc,hpa,pod --all
[도전과제1] HPA : Autoscaling on multiple metrics and custom metrics - 링크
apiVersion: autoscaling/v2
kind: HorizontalPodAutoscaler
metadata:
  name: php-apache
spec:
  minReplicas: 1
  maxReplicas: 10
  scaleTargetRef:
    apiVersion: apps/v1
    kind: Deployment
    name: php-apache
  metrics:
  - type: Resource
    resource:
      name: cpu
      target:
        type: Utilization
        averageUtilization: 50
  - type: Pods
    pods:
      metric:
        name: packets-per-second
      target:
        type: AverageValue
        averageValue: 1k
  - type: Object
    object:
      metric:
        name: requests-per-second
      describedObject:
        apiVersion: networking.k8s.io/v1
        kind: Ingress
        name: main-route
      target:
        type: Value
        value: 10k
2. KEDA - Kubernetes based Event Driven Autoscaler
[ About KEDA ]
☞ KEDA AutoScaler 소개 - Docs , DevOcean
기존의 HPA(Horizontal Pod Autoscaler)는 리소스(CPU, Memory) 메트릭을 기반으로 스케일 여부를 결정하게 됩니다.
반면에 KEDA는 특정 이벤트를 기반으로 스케일 여부를 결정할 수 있습니다.
예를 들어 airflow는 metadb를 통해 현재 실행 중이거나 대기 중인 task가 얼마나 존재하는지 알 수 있습니다.
이러한 이벤트를 활용하여 worker의 scale을 결정한다면 queue에 task가 많이 추가되는 시점에 더 빠르게 확장할 수 있습니다.

- Agent — KEDA activates and deactivates Kubernetes Deployments to scale to and from zero on no events. This is one of the primary roles of the keda-operator container that runs when you install KEDA.
- Metrics — KEDA acts as a Kubernetes metrics server that exposes rich event data like queue length or stream lag to the Horizontal Pod Autoscaler to drive scale out. It is up to the Deployment to consume the events directly from the source. This preserves rich event integration and enables gestures like completing or abandoning queue messages to work out of the box. The metric serving is the primary role of the keda-operator-metrics-apiserver container that runs when you install KEDA.
- Admission Webhooks - Automatically validate resource changes to prevent misconfiguration and enforce best practices by using an admission controller. As an example, it will prevent multiple ScaledObjects to target the same scale target. keda-admission-webhooks
kubectl get pod -n keda
NAME                                               READY   STATUS    RESTARTS      AGE
keda-operator-6bdffdc78-5rqnp                      1/1     Running   1 (11m ago)   11m
keda-operator-metrics-apiserver-74d844d769-2vrcq   1/1     Running   0             11m
keda-admission-webhooks-86cffccbf5-kmb7v           1/1     Running   0             11m
예) KEDA Scalers : kafka trigger for an Apache Kafka topic - Link
KEDA | Apache Kafka
Scale applications based on an Apache Kafka topic or other services that support Kafka protocol.
keda.sh
triggers:
- type: kafka
  metadata:
    bootstrapServers: kafka.svc:9092
    consumerGroup: my-group
    topic: test-topic
    lagThreshold: '5' # Average target value to trigger scaling actions. (Default: 5, Optional)
    activationLagThreshold: '3' #  Target value for activating the scaler. Learn more about activation here.
    offsetResetPolicy: latest
    allowIdleConsumers: false
    scaleToZeroOnInvalidOffset: false
    excludePersistentLag: false
    limitToPartitionsWithLag: false
    version: 1.0.0
    partitionLimitation: '1,2,10-20,31'
    sasl: plaintext
    tls: enable
    unsafeSsl: 'false'
☞ KEDA with Helm : 특정 이벤트(cron 등)기반의 파드 오토 스케일링 - Chart , Grafana , Cron , SQS_Scale , aws-sqs-queue
☞ KEDA 대시보드 Import : https://github.com/kedacore/keda/blob/main/config/grafana/keda-dashboard.json

# 설치 전 기존 metrics-server 제공 Metris API 확인
kubectl get --raw "/apis/metrics.k8s.io" -v=6 | jq
kubectl get --raw "/apis/metrics.k8s.io" | jq
{
  "kind": "APIGroup",
  "apiVersion": "v1",
  "name": "metrics.k8s.io",
  ...


# KEDA 설치 : serviceMonitor 만으로도 충분할듯..
cat <<EOT > keda-values.yaml
metricsServer:
  useHostNetwork: true

prometheus:
  metricServer:
    enabled: true
    port: 9022
    portName: metrics
    path: /metrics
    serviceMonitor:
      # Enables ServiceMonitor creation for the Prometheus Operator
      enabled: true
    podMonitor:
      # Enables PodMonitor creation for the Prometheus Operator
      enabled: true
  operator:
    enabled: true
    port: 8080
    serviceMonitor:
      # Enables ServiceMonitor creation for the Prometheus Operator
      enabled: true
    podMonitor:
      # Enables PodMonitor creation for the Prometheus Operator
      enabled: true
  webhooks:
    enabled: true
    port: 8020
    serviceMonitor:
      # Enables ServiceMonitor creation for the Prometheus webhooks
      enabled: true
EOT

helm repo add kedacore https://kedacore.github.io/charts
helm repo update
helm install keda kedacore/keda --version 2.16.0 --namespace keda --create-namespace -f keda-values.yaml

# KEDA 설치 확인
kubectl get crd | grep keda
kubectl get all -n keda
kubectl get validatingwebhookconfigurations keda-admission -o yaml
kubectl get podmonitor,servicemonitors -n keda
kubectl get apiservice v1beta1.external.metrics.k8s.io -o yaml

# CPU/Mem은 기존 metrics-server 의존하여, KEDA metrics-server는 외부 이벤트 소스(Scaler) 메트릭을 노출
## https://keda.sh/docs/2.16/operate/metrics-server/
kubectl get pod -n keda -l app=keda-operator-metrics-apiserver

# Querying metrics exposed by KEDA Metrics Server
kubectl get --raw "/apis/external.metrics.k8s.io/v1beta1" | jq
{
  "kind": "APIResourceList",
  "apiVersion": "v1",
  "groupVersion": "external.metrics.k8s.io/v1beta1",
  "resources": [
    {
      "name": "externalmetrics",
      "singularName": "",
      "namespaced": true,
      "kind": "ExternalMetricValueList",
      "verbs": [
        "get"
      ]
    }
  ]
}

# keda 네임스페이스에 디플로이먼트 생성
kubectl apply -f php-apache.yaml -n keda
kubectl get pod -n keda

# ScaledObject 정책 생성 : cron
cat <<EOT > keda-cron.yaml
apiVersion: keda.sh/v1alpha1
kind: ScaledObject
metadata:
  name: php-apache-cron-scaled
spec:
  minReplicaCount: 0
  maxReplicaCount: 2  # Specifies the maximum number of replicas to scale up to (defaults to 100).
  pollingInterval: 30  # Specifies how often KEDA should check for scaling events
  cooldownPeriod: 300  # Specifies the cool-down period in seconds after a scaling event
  scaleTargetRef:  # Identifies the Kubernetes deployment or other resource that should be scaled.
    apiVersion: apps/v1
    kind: Deployment
    name: php-apache
  triggers:  # Defines the specific configuration for your chosen scaler, including any required parameters or settings
  - type: cron
    metadata:
      timezone: Asia/Seoul
      start: 00,15,30,45 * * * *
      end: 05,20,35,50 * * * *
      desiredReplicas: "1"
EOT
kubectl apply -f keda-cron.yaml -n keda

# 그라파나 대시보드 추가 : 대시보드 상단에 namespace : keda 로 변경하기!
# KEDA 대시보드 Import : https://github.com/kedacore/keda/blob/main/config/grafana/keda-dashboard.json

# 모니터링
watch -d 'kubectl get ScaledObject,hpa,pod -n keda'
kubectl get ScaledObject -w

# 확인
kubectl get ScaledObject,hpa,pod -n keda
kubectl get hpa -o jsonpath="{.items[0].spec}" -n keda | jq
...
"metrics": [
    {
      "external": {
        "metric": {
          "name": "s0-cron-Asia-Seoul-00,15,30,45xxxx-05,20,35,50xxxx",
          "selector": {
            "matchLabels": {
              "scaledobject.keda.sh/name": "php-apache-cron-scaled"
            }
          }
        },
        "target": {
          "averageValue": "1",
          "type": "AverageValue"
        }
      },
      "type": "External"
    }

# KEDA 및 deployment 등 삭제
kubectl delete ScaledObject -n keda php-apache-cron-scaled && kubectl delete deploy php-apache -n keda && helm uninstall keda -n keda
kubectl delete namespace keda
- 실행 결과 : Link
[도전과제2] KEDA 활용 : Karpenter + KEDA로 특정 시간에 AutoScaling - 링크 , Youtube , Airflow , Blog
[도전과제] KEDA HTTP Add-on 사용해보기 - Docs , Github

3. VPA - Vertical Pod Autoscaler
[ VPA 란? ] - Github , DevOcean
☞ Resouce Autoscaler 에 request, limit 값을 정해 놓고 모니터링 임계치 초과 시, scale-up/down 방식으로 자원을 조정하는 방법


▶ 실습
1) 프로메테우스 및 그라파나 연동
- 상단 cluster 는 현재 프로메테우스 메트릭 label에 없으니 무시해도됨! - 링크 14588

프로메테우스 - PMQL 조회
kube_customresource_vpa_containerrecommendations_target
kube_customresource_vpa_containerrecommendations_target{resource="cpu"}
kube_customresource_vpa_containerrecommendations_target{resource="memory"}

[ 코드 실습 ]
Step1. VPA Webhook 환경 설정
# [운영서버 EC2] 코드 다운로드
## git clone https://github.com/kubernetes/autoscaler.git # userdata 로 설치 되어 있음
cd ~/autoscaler/vertical-pod-autoscaler/
tree hack

# openssl 버전 확인
openssl version
OpenSSL 1.0.2k-fips  26 Jan 2017

# 1.0 제거
yum remove openssl -y

# openssl 1.1.1 이상 버전 확인
yum install openssl11 -y
openssl11 version
OpenSSL 1.1.1g FIPS  21 Apr 2020

# 스크립트파일내에 openssl11 수정
sed -i 's/openssl/openssl11/g' ~/autoscaler/vertical-pod-autoscaler/pkg/admission-controller/gencerts.sh
git status
git config --global user.email "you@example.com"
git config --global user.name "Your Name"
git add .
git commit -m "openssl version modify"

# Deploy the Vertical Pod Autoscaler to your cluster with the following command.
watch -d kubectl get pod -n kube-system
cat hack/vpa-up.sh
./hack/vpa-up.sh

# 재실행!
sed -i 's/openssl/openssl11/g' ~/autoscaler/vertical-pod-autoscaler/pkg/admission-controller/gencerts.sh
./hack/vpa-up.sh

kubectl get crd | grep autoscaling
kubectl get mutatingwebhookconfigurations vpa-webhook-config
kubectl get mutatingwebhookconfigurations vpa-webhook-config -o json | jq
Step2. 공식 예제 : pod가 실행되면 약 2~3분 뒤에 pod resource.reqeust가 VPA에 의해 수정 - 링크
- vpa에 spec.updatePolicy.updateMode를 Off 로 변경 시 파드에 Spec을 자동으로 변경 재실행 하지 않습니다. 기본값(Auto)

# 모니터링
watch -d "kubectl top pod;echo "----------------------";kubectl describe pod | grep Requests: -A2"

# 공식 예제 배포
## cd ~/autoscaler/vertical-pod-autoscaler/
cat examples/hamster.yaml
kubectl apply -f examples/hamster.yaml && kubectl get vpa -w

# 파드 리소스 Requestes 확인
kubectl describe pod | grep Requests: -A2
    Requests:
      cpu:        100m
      memory:     50Mi
--
    Requests:
      cpu:        587m
      memory:     262144k
--
    Requests:
      cpu:        587m
      memory:     262144k

# VPA에 의해 기존 파드 삭제되고 신규 파드가 생성됨
kubectl get events --sort-by=".metadata.creationTimestamp" | grep VPA
2m16s       Normal    EvictedByVPA             pod/hamster-5bccbb88c6-s6jkp         Pod was evicted by VPA Updater to apply resource recommendation.
76s         Normal    EvictedByVPA             pod/hamster-5bccbb88c6-jc6gq         Pod was evicted by VPA Updater to apply resource recommendation.
Step3. 자원 정리
kubectl delete -f examples/hamster.yaml && cd ~/autoscaler/vertical-pod-autoscaler/ && ./hack/vpa-down.sh
4. CAS - Cluster Autoscaler
☞ 구성 소개 - Github , AWS , example
[ 동작원리 ]
- a component that automatically adjusts the size of a Kubernetes Cluster so that all pods have a place to run and there are no unneeded nodes. Supports several public cloud providers. Version 1.0 (GA) was released with kubernetes 1.8.
- The Kubernetes Cluster Autoscaler automatically adjusts the size of a Kubernetes cluster when one of the following conditions is true:
- There are pods that fail to run in a cluster due to insufficient resources.
- There are nodes in a cluster that are underutilized for an extended period of time and their pods can be placed on other existing nodes.
- On AWS, Cluster Autoscaler utilizes Amazon EC2 Auto Scaling Groups to manage node groups. Cluster Autoscaler typically runs as a Deployment in your cluster.

- Cluster Autoscale 동작을 하기 위한 cluster-autoscaler 파드(디플로이먼트)를 배치합니다.
- **Cluster Autoscaler(CAS)**는 pending 상태인 파드가 존재할 경우, 워커 노드를 스케일 아웃합니다.
- 특정 시간을 간격으로 사용률을 확인하여 스케일 인/아웃을 수행합니다. 그리고 AWS에서는 Auto Scaling Group(ASG)을 사용하여 Cluster Autoscaler를 적용합니다.
▶ Cluster Autoscaler(CAS) 설정 - Workshop , Helm
Step1. 설정 전 확인사항 ( Tag )
# EKS 노드에 이미 아래 tag가 들어가 있음
# k8s.io/cluster-autoscaler/enabled : true
# k8s.io/cluster-autoscaler/myeks : owned
aws ec2 describe-instances  --filters Name=tag:Name,Values=$CLUSTER_NAME-ng1-Node --query "Reservations[*].Instances[*].Tags[*]" --output json | jq
aws ec2 describe-instances  --filters Name=tag:Name,Values=$CLUSTER_NAME-ng1-Node --query "Reservations[*].Instances[*].Tags[*]" --output yaml
...
- Key: k8s.io/cluster-autoscaler/myeks
      Value: owned
- Key: k8s.io/cluster-autoscaler/enabled
      Value: 'true'
...
Step2. AutoScaler 실습
Cluster Autoscaler for AWS provides integration with Auto Scaling groups. It enables users to choose from four different options of deployment:
- One Auto Scaling group
- Multiple Auto Scaling groups
- Auto-Discovery : Auto-Discovery is the preferred method to configure Cluster Autoscaler. Click here for more information.
- Control-plane Node setup
Cluster Autoscaler will attempt to determine the CPU, memory, and GPU resources provided by an Auto Scaling Group based on the instance type specified in its Launch Configuration or Launch Template.
# 현재 autoscaling(ASG) 정보 확인
# aws autoscaling describe-auto-scaling-groups --query "AutoScalingGroups[? Tags[? (Key=='eks:cluster-name') && Value=='클러스터이름']].[AutoScalingGroupName, MinSize, MaxSize,DesiredCapacity]" --output table
aws autoscaling describe-auto-scaling-groups \
    --query "AutoScalingGroups[? Tags[? (Key=='eks:cluster-name') && Value=='myeks']].[AutoScalingGroupName, MinSize, MaxSize,DesiredCapacity]" \
    --output table
-----------------------------------------------------------------
|                   DescribeAutoScalingGroups                   |
+------------------------------------------------+----+----+----+
|  eks-ng1-44c41109-daa3-134c-df0e-0f28c823cb47  |  3 |  3 |  3 |
+------------------------------------------------+----+----+----+

# MaxSize 6개로 수정
export ASG_NAME=$(aws autoscaling describe-auto-scaling-groups --query "AutoScalingGroups[? Tags[? (Key=='eks:cluster-name') && Value=='myeks']].AutoScalingGroupName" --output text)
aws autoscaling update-auto-scaling-group --auto-scaling-group-name ${ASG_NAME} --min-size 3 --desired-capacity 3 --max-size 6

# 확인
aws autoscaling describe-auto-scaling-groups --query "AutoScalingGroups[? Tags[? (Key=='eks:cluster-name') && Value=='myeks']].[AutoScalingGroupName, MinSize, MaxSize,DesiredCapacity]" --output table
-----------------------------------------------------------------
|                   DescribeAutoScalingGroups                   |
+------------------------------------------------+----+----+----+
|  eks-ng1-c2c41e26-6213-a429-9a58-02374389d5c3  |  3 |  6 |  3 |
+------------------------------------------------+----+----+----+

# 배포 : Deploy the Cluster Autoscaler (CAS)
curl -s -O https://raw.githubusercontent.com/kubernetes/autoscaler/master/cluster-autoscaler/cloudprovider/aws/examples/cluster-autoscaler-autodiscover.yaml
...
            - ./cluster-autoscaler
            - --v=4
            - --stderrthreshold=info
            - --cloud-provider=aws
            - --skip-nodes-with-local-storage=false # 로컬 스토리지를 가진 노드를 autoscaler가 scale down할지 결정, false(가능!)
            - --expander=least-waste # 노드를 확장할 때 어떤 노드 그룹을 선택할지를 결정, least-waste는 리소스 낭비를 최소화하는 방식으로 새로운 노드를 선택.
            - --node-group-auto-discovery=asg:tag=k8s.io/cluster-autoscaler/enabled,k8s.io/cluster-autoscaler/<YOUR CLUSTER NAME>
...

sed -i -e "s|<YOUR CLUSTER NAME>|$CLUSTER_NAME|g" cluster-autoscaler-autodiscover.yaml
kubectl apply -f cluster-autoscaler-autodiscover.yaml

# 확인
kubectl get pod -n kube-system | grep cluster-autoscaler
kubectl describe deployments.apps -n kube-system cluster-autoscaler
kubectl describe deployments.apps -n kube-system cluster-autoscaler | grep node-group-auto-discovery
      --node-group-auto-discovery=asg:tag=k8s.io/cluster-autoscaler/enabled,k8s.io/cluster-autoscaler/myeks

# (옵션) cluster-autoscaler 파드가 동작하는 워커 노드가 퇴출(evict) 되지 않게 설정
kubectl -n kube-system annotate deployment.apps/cluster-autoscaler cluster-autoscaler.kubernetes.io/safe-to-evict="false"
▶ SCALE A CLUSTER WITH Cluster Autoscaler(CA) - Link

Step1. Node Scaling 확인
# 모니터링
kubectl get nodes -w
while true; do kubectl get node; echo "------------------------------" ; date ; sleep 1; done
while true; do aws ec2 describe-instances --query "Reservations[*].Instances[*].{PrivateIPAdd:PrivateIpAddress,InstanceName:Tags[?Key=='Name']|[0].Value,Status:State.Name}" --filters Name=instance-state-name,Values=running --output text ; echo "------------------------------"; date; sleep 1; done

# Deploy a Sample App
# We will deploy an sample nginx application as a ReplicaSet of 1 Pod
cat << EOF > nginx.yaml
apiVersion: apps/v1
kind: Deployment
metadata:
  name: nginx-to-scaleout
spec:
  replicas: 1
  selector:
    matchLabels:
      app: nginx
  template:
    metadata:
      labels:
        service: nginx
        app: nginx
    spec:
      containers:
      - image: nginx
        name: nginx-to-scaleout
        resources:
          limits:
            cpu: 500m
            memory: 512Mi
          requests:
            cpu: 500m
            memory: 512Mi
EOF
kubectl apply -f nginx.yaml
kubectl get deployment/nginx-to-scaleout

# Scale our ReplicaSet
# Let’s scale out the replicaset to 15
kubectl scale --replicas=15 deployment/nginx-to-scaleout && date

# 확인
kubectl get pods -l app=nginx -o wide --watch
kubectl -n kube-system logs -f deployment/cluster-autoscaler

# 노드 자동 증가 확인
kubectl get nodes
aws autoscaling describe-auto-scaling-groups \
    --query "AutoScalingGroups[? Tags[? (Key=='eks:cluster-name') && Value=='myeks']].[AutoScalingGroupName, MinSize, MaxSize,DesiredCapacity]" \
    --output table

eks-node-viewer --resources cpu,memory
혹은
eks-node-viewer

# [운영서버 EC2] 최근 1시간 Fleet API 호출 확인 - Link
# https://ap-northeast-2.console.aws.amazon.com/cloudtrailv2/home?region=ap-northeast-2#/events?EventName=CreateFleet
aws cloudtrail lookup-events \
  --lookup-attributes AttributeKey=EventName,AttributeValue=CreateFleet \
  --start-time "$(date -d '1 hour ago' --utc +%Y-%m-%dT%H:%M:%SZ)" \
  --end-time "$(date --utc +%Y-%m-%dT%H:%M:%SZ)"

# (참고) Event name : UpdateAutoScalingGroup
# https://ap-northeast-2.console.aws.amazon.com/cloudtrailv2/home?region=ap-northeast-2#/events?EventName=UpdateAutoScalingGroup


# 디플로이먼트 삭제
kubectl delete -f nginx.yaml && date

# [scale-down] 노드 갯수 축소 : 기본은 10분 후 scale down 됨, 물론 아래 flag 로 시간 수정 가능 >> 그러니 디플로이먼트 삭제 후 10분 기다리고 나서 보자!
# By default, cluster autoscaler will wait 10 minutes between scale down operations,
# you can adjust this using the --scale-down-delay-after-add, --scale-down-delay-after-delete,
# and --scale-down-delay-after-failure flag.
# E.g. --scale-down-delay-after-add=5m to decrease the scale down delay to 5 minutes after a node has been added.

# 터미널1
watch -d kubectl get node
Step2. CloudTrail 에 CreateFleet 이벤트 확인 - Link
# CloudTrail 에 CreateFleet 이벤트 조회 : 최근 90일 가능
aws cloudtrail lookup-events --lookup-attributes AttributeKey=EventName,AttributeValue=CreateFleet
[ AWS 콘솔 확인 ]

[ 실행 결과 - 한 눈에 보기 ]


▶ 리소스 삭제
# 위 실습 중 디플로이먼트 삭제 후 10분 후 노드 갯수 축소되는 것을 확인 후 아래 삭제를 해보자! >> 만약 바로 아래 CA 삭제 시 워커 노드는 4개 상태가 되어서 수동으로 2대 변경 하자!
kubectl delete -f nginx.yaml

# size 수정
aws autoscaling update-auto-scaling-group --auto-scaling-group-name ${ASG_NAME} --min-size 3 --desired-capacity 3 --max-size 3
aws autoscaling describe-auto-scaling-groups --query "AutoScalingGroups[? Tags[? (Key=='eks:cluster-name') && Value=='myeks']].[AutoScalingGroupName, MinSize, MaxSize,DesiredCapacity]" --output table

# Cluster Autoscaler 삭제
kubectl delete -f cluster-autoscaler-autodiscover.yaml
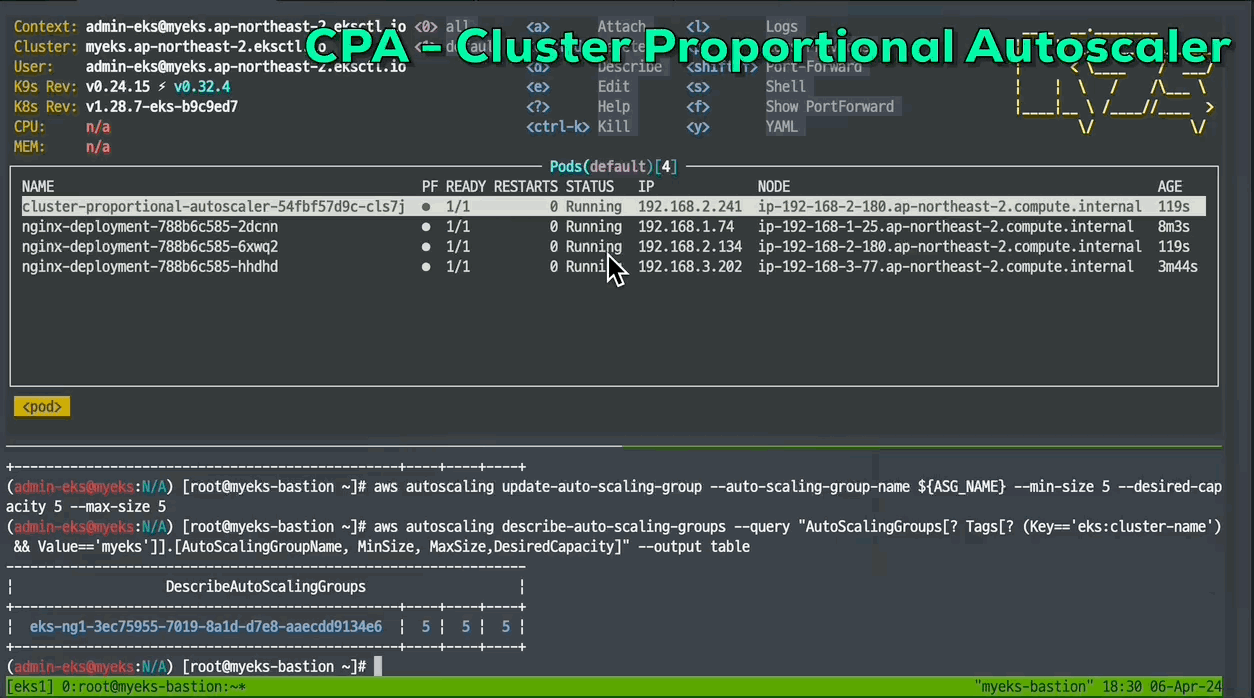
5. CPA - Cluster Proportional Autoscaler
[ CPA란 ? ]
☞ 노드 수 증가에 비례하여 성능 처리가 필요한 애플리케이션(컨테이너/파드)를 수평으로 자동 확장하는 기능

[ 실습 ]
[ 동작화면 ]
#
helm repo add cluster-proportional-autoscaler https://kubernetes-sigs.github.io/cluster-proportional-autoscaler

# CPA규칙을 설정하고 helm차트를 릴리즈 필요
helm upgrade --install cluster-proportional-autoscaler cluster-proportional-autoscaler/cluster-proportional-autoscaler

# nginx 디플로이먼트 배포
cat <<EOT > cpa-nginx.yaml
apiVersion: apps/v1
kind: Deployment
metadata:
  name: nginx-deployment
spec:
  replicas: 1
  selector:
    matchLabels:
      app: nginx
  template:
    metadata:
      labels:
        app: nginx
    spec:
      containers:
      - name: nginx
        image: nginx:latest
        resources:
          limits:
            cpu: "100m"
            memory: "64Mi"
          requests:
            cpu: "100m"
            memory: "64Mi"
        ports:
        - containerPort: 80
EOT
kubectl apply -f cpa-nginx.yaml

# CPA 규칙 설정
cat <<EOF > cpa-values.yaml
config:
  ladder:
    nodesToReplicas:
      - [1, 1]
      - [2, 2]
      - [3, 3]
      - [4, 3]
      - [5, 5]
options:
  namespace: default
  target: "deployment/nginx-deployment"
EOF
kubectl describe cm cluster-proportional-autoscaler

# 모니터링
watch -d kubectl get pod

# helm 업그레이드
helm upgrade --install cluster-proportional-autoscaler -f cpa-values.yaml cluster-proportional-autoscaler/cluster-proportional-autoscaler

# 노드 5개로 증가
export ASG_NAME=$(aws autoscaling describe-auto-scaling-groups --query "AutoScalingGroups[? Tags[? (Key=='eks:cluster-name') && Value=='myeks']].AutoScalingGroupName" --output text)
aws autoscaling update-auto-scaling-group --auto-scaling-group-name ${ASG_NAME} --min-size 5 --desired-capacity 5 --max-size 5
aws autoscaling describe-auto-scaling-groups --query "AutoScalingGroups[? Tags[? (Key=='eks:cluster-name') && Value=='myeks']].[AutoScalingGroupName, MinSize, MaxSize,DesiredCapacity]" --output table

# 노드 4개로 축소
aws autoscaling update-auto-scaling-group --auto-scaling-group-name ${ASG_NAME} --min-size 4 --desired-capacity 4 --max-size 4
aws autoscaling describe-auto-scaling-groups --query "AutoScalingGroups[? Tags[? (Key=='eks:cluster-name') && Value=='myeks']].[AutoScalingGroupName, MinSize, MaxSize,DesiredCapacity]" --output table
▶ 자원삭제
helm uninstall cluster-proportional-autoscaler && kubectl delete -f cpa-nginx.yaml
[ 자원 전체삭제 : karpenter 실습 위해, Operation EC2 에서 수행 ]
# eksctl delete cluster --name $CLUSTER_NAME && aws cloudformation delete-stack --stack-name $CLUSTER_NAME
nohup sh -c "eksctl delete cluster --name $CLUSTER_NAME && aws cloudformation delete-stack --stack-name $CLUSTER_NAME" > /root/delete.log 2>&1 &
# (옵션) 삭제 과정 확인
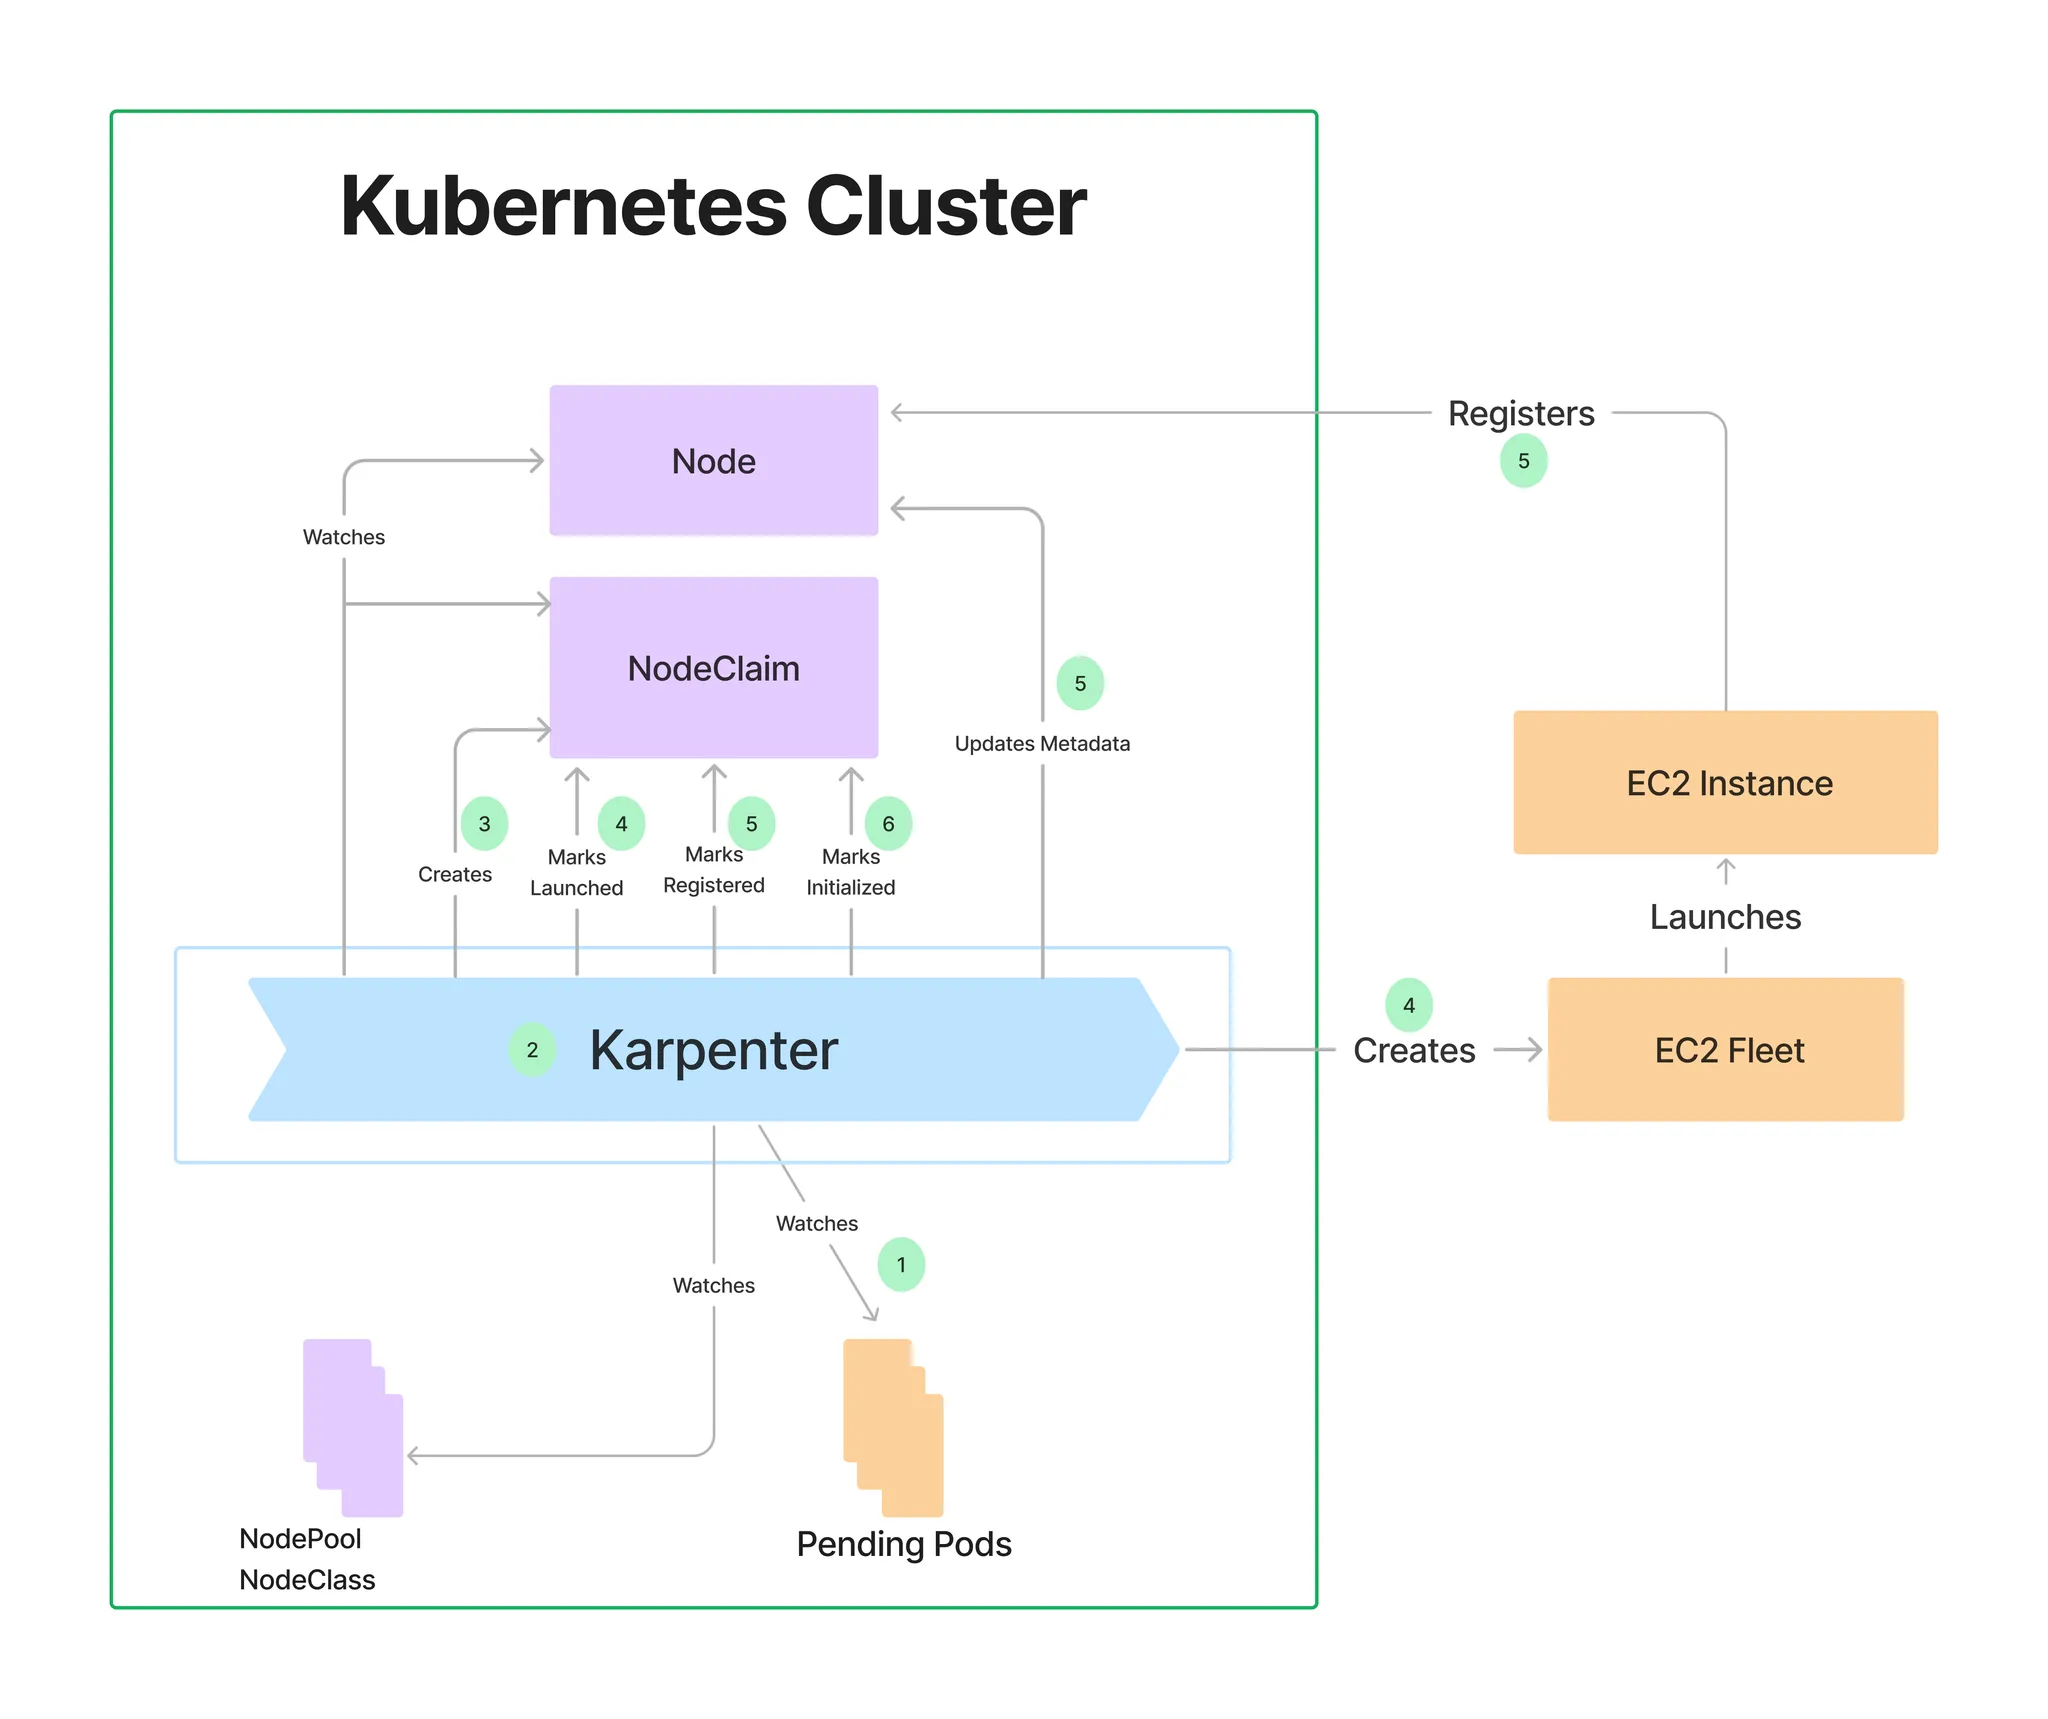
tail -f delete.log6. Karpenter
☞ karpenter는 AWS로 구축된 유연한 오픈 소스의 고성능 Kubernetes 클러스터 오토스케일러입니다. 애플리케이션 로드의 변화에 대응하여 적절한 크기의 컴퓨팅 리소스를 신속하게 실행함으로써 애플리케이션 가용성과 클러스터 효율성을 개선할 수 있습니다.
[ karpenter 특징 ] - 참고 Link
- ASG( Auto-Scaling Group ) 기반의 CA와 달리 AWS Fleet API를 사용하여 보다 빠르게 provisioning을 할 수 있다!!
- POD 배치 시에도, Node-Binding 기법을 사용하여 Scheduler를 사용하지 않는다.
- 다양한 인스턴스 적용의 최소 : Provisioner 를 통해 보다 쉽게 노드 유형선언 및 사용이 가능하다.
[ karpenter 와 CA 의 동작 차이 ]

▶ Getting Started with Karpenter 실습 - Docs
Step1. Install utilities
- AWS CLI : 자격증명 설정
- kubectl - the Kubernetes CLI
- eksctl (>= v0.202.0) - the CLI for AWS EKS
- helm - the package manager for Kubernetes
- eks-node-view
Step2. 환경 변수 설정
# 변수 설정
export KARPENTER_NAMESPACE="kube-system"
export KARPENTER_VERSION="1.2.1"
export K8S_VERSION="1.32"

export AWS_PARTITION="aws" # if you are not using standard partitions, you may need to configure to aws-cn / aws-us-gov
export CLUSTER_NAME="gasida-karpenter-demo" # ${USER}-karpenter-demo
export AWS_DEFAULT_REGION="ap-northeast-2"
export AWS_ACCOUNT_ID="$(aws sts get-caller-identity --query Account --output text)"
export TEMPOUT="$(mktemp)"
export ALIAS_VERSION="$(aws ssm get-parameter --name "/aws/service/eks/optimized-ami/${K8S_VERSION}/amazon-linux-2023/x86_64/standard/recommended/image_id" --query Parameter.Value | xargs aws ec2 describe-images --query 'Images[0].Name' --image-ids | sed -r 's/^.*(v[[:digit:]]+).*$/\1/')"

# 확인
echo "${KARPENTER_NAMESPACE}" "${KARPENTER_VERSION}" "${K8S_VERSION}" "${CLUSTER_NAME}" "${AWS_DEFAULT_REGION}" "${AWS_ACCOUNT_ID}" "${TEMPOUT}" "${ALIAS_VERSION}"
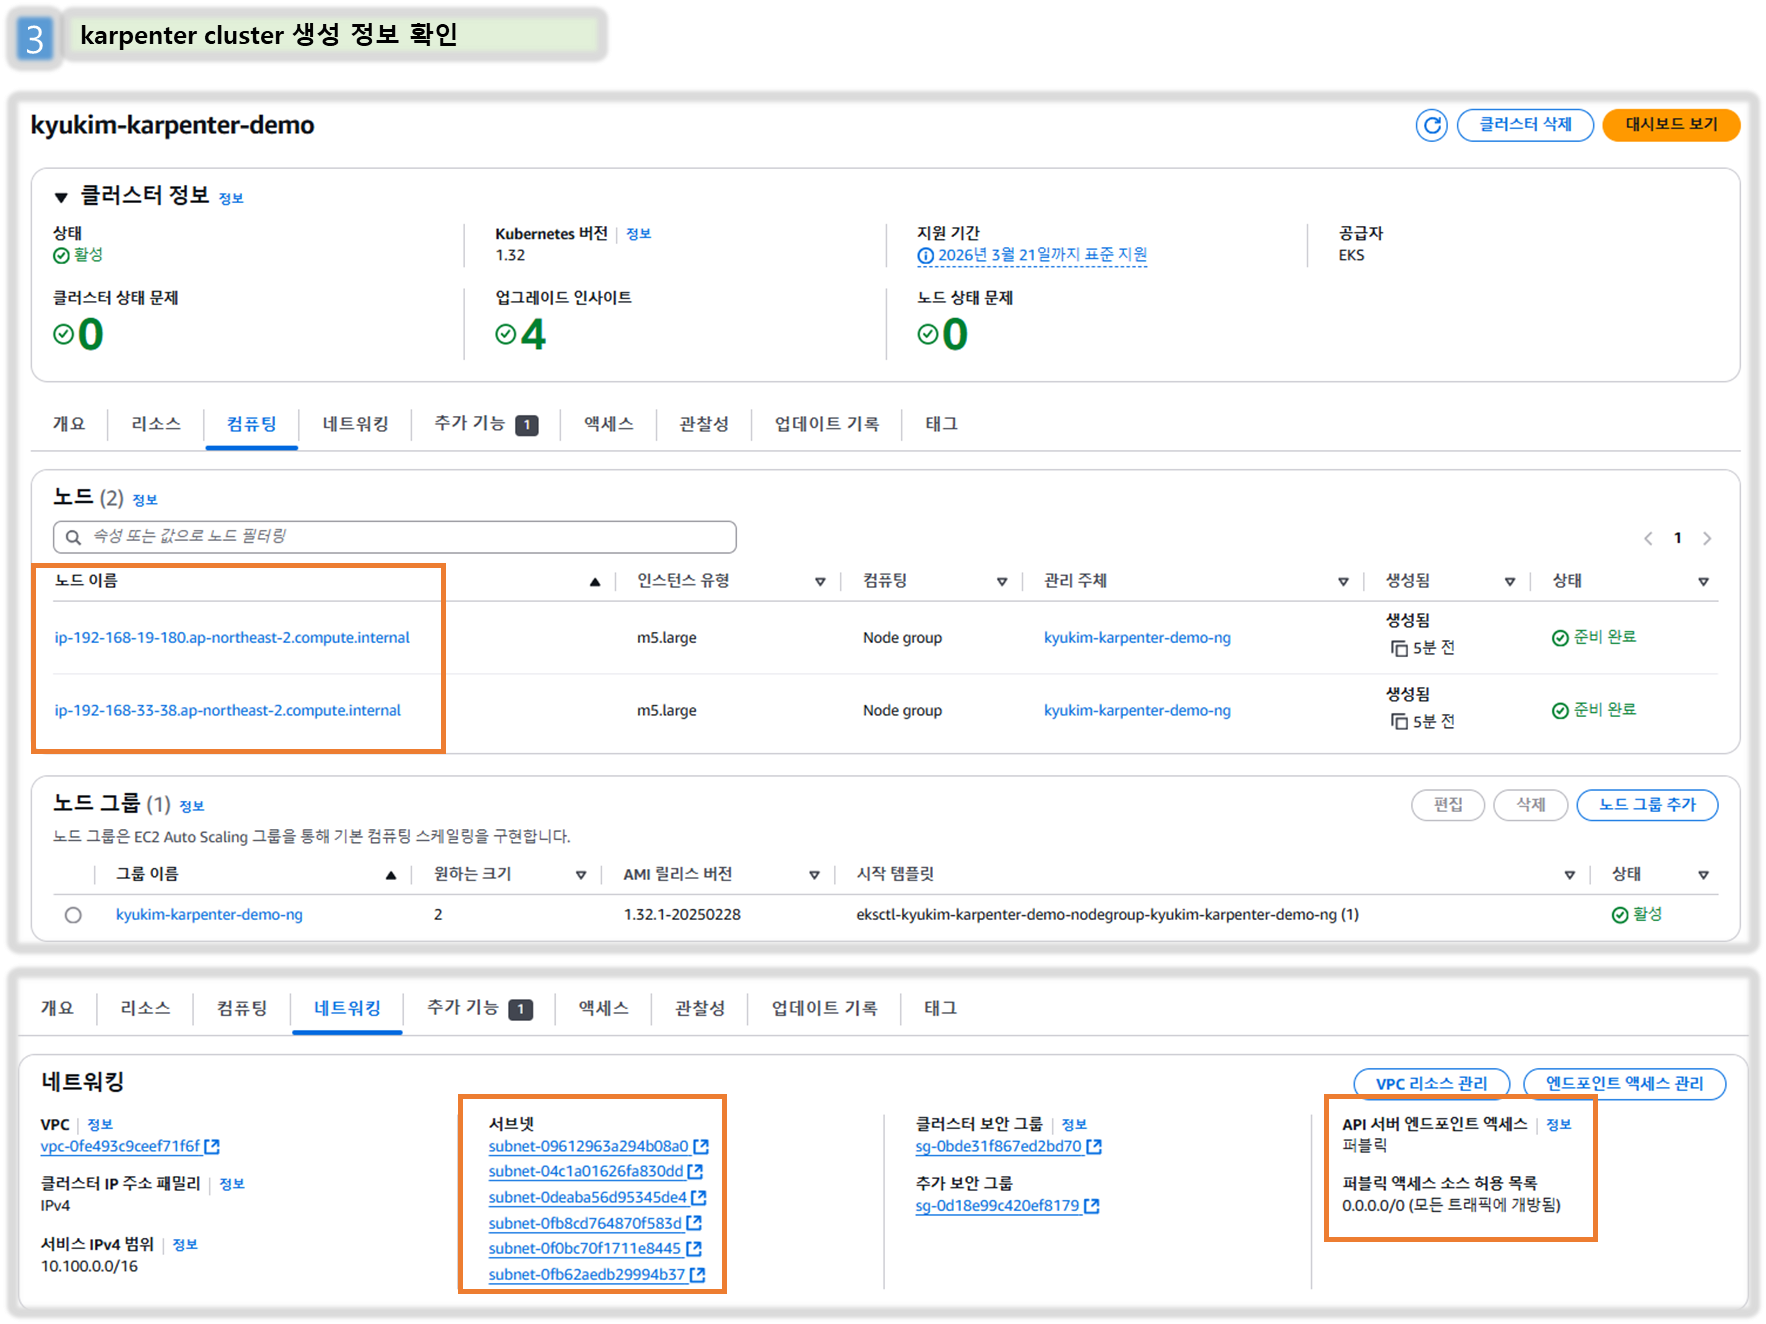
Step3. 클러스터 생성
- Use CloudFormation to set up the infrastructure needed by the EKS cluster. See CloudFormation for a complete description of what cloudformation.yaml does for Karpenter.
- Create a Kubernetes service account and AWS IAM Role, and associate them using IRSA to let Karpenter launch instances.
- Add the Karpenter node role to the aws-auth configmap to allow nodes to connect.
- Use AWS EKS managed node groups for the kube-system and karpenter namespaces. Uncomment fargateProfiles settings (and comment out managedNodeGroups settings) to use Fargate for both namespaces instead.
- Set KARPENTER_IAM_ROLE_ARN variables.
- Create a role to allow spot instances.
- Run Helm to install Karpenter
# CloudFormation 스택으로 IAM Policy/Role, SQS, Event/Rule 생성 : 3분 정도 소요
## IAM Policy : KarpenterControllerPolicy-gasida-karpenter-demo
## IAM Role : KarpenterNodeRole-gasida-karpenter-demo
curl -fsSL https://raw.githubusercontent.com/aws/karpenter-provider-aws/v"${KARPENTER_VERSION}"/website/content/en/preview/getting-started/getting-started-with-karpenter/cloudformation.yaml  > "${TEMPOUT}" \
&& aws cloudformation deploy \
  --stack-name "Karpenter-${CLUSTER_NAME}" \
  --template-file "${TEMPOUT}" \
  --capabilities CAPABILITY_NAMED_IAM \
  --parameter-overrides "ClusterName=${CLUSTER_NAME}"


# 클러스터 생성 : EKS 클러스터 생성 15분 정도 소요
eksctl create cluster -f - <<EOF
---
apiVersion: eksctl.io/v1alpha5
kind: ClusterConfig
metadata:
  name: ${CLUSTER_NAME}
  region: ${AWS_DEFAULT_REGION}
  version: "${K8S_VERSION}"
  tags:
    karpenter.sh/discovery: ${CLUSTER_NAME}

iam:
  withOIDC: true
  podIdentityAssociations:
  - namespace: "${KARPENTER_NAMESPACE}"
    serviceAccountName: karpenter
    roleName: ${CLUSTER_NAME}-karpenter
    permissionPolicyARNs:
    - arn:${AWS_PARTITION}:iam::${AWS_ACCOUNT_ID}:policy/KarpenterControllerPolicy-${CLUSTER_NAME}

iamIdentityMappings:
- arn: "arn:${AWS_PARTITION}:iam::${AWS_ACCOUNT_ID}:role/KarpenterNodeRole-${CLUSTER_NAME}"
  username: system:node:{{EC2PrivateDNSName}}
  groups:
  - system:bootstrappers
  - system:nodes
  ## If you intend to run Windows workloads, the kube-proxy group should be specified.
  # For more information, see https://github.com/aws/karpenter/issues/5099.
  # - eks:kube-proxy-windows

managedNodeGroups:
- instanceType: m5.large
  amiFamily: AmazonLinux2023
  name: ${CLUSTER_NAME}-ng
  desiredCapacity: 2
  minSize: 1
  maxSize: 10
  iam:
    withAddonPolicies:
      externalDNS: true

addons:
- name: eks-pod-identity-agent
EOF


# eks 배포 확인
eksctl get cluster
eksctl get nodegroup --cluster $CLUSTER_NAME
eksctl get iamidentitymapping --cluster $CLUSTER_NAME
eksctl get iamserviceaccount --cluster $CLUSTER_NAME
eksctl get addon --cluster $CLUSTER_NAME

#
kubectl ctx
kubectl config rename-context "<각자 자신의 IAM User>@<자신의 Nickname>-karpenter-demo.ap-northeast-2.eksctl.io" "karpenter-demo"
kubectl config rename-context "admin@gasida-karpenter-demo.ap-northeast-2.eksctl.io" "karpenter-demo"

# k8s 확인
kubectl ns default
kubectl cluster-info
kubectl get node --label-columns=node.kubernetes.io/instance-type,eks.amazonaws.com/capacityType,topology.kubernetes.io/zone
kubectl get pod -n kube-system -owide
kubectl get pdb -A
kubectl describe cm -n kube-system aws-auth

# EC2 Spot Fleet의 service-linked-role 생성 확인 : 만들어있는것을 확인하는 거라 아래 에러 출력이 정상!
# If the role has already been successfully created, you will see:
# An error occurred (InvalidInput) when calling the CreateServiceLinkedRole operation: Service role name AWSServiceRoleForEC2Spot has been taken in this account, please try a different suffix.
aws iam create-service-linked-role --aws-service-name spot.amazonaws.com || true
[ 실행 결과 - 한 눈에 보기 ]


[ AWS 콘솔 - EKS → Access , Add-ons 확인 ]

Step4. 실습 동작 확인을 위한 도구 설치 : kube-ops-view
# kube-ops-view
helm repo add geek-cookbook https://geek-cookbook.github.io/charts/
helm install kube-ops-view geek-cookbook/kube-ops-view --version 1.2.2 --set service.main.type=LoadBalancer --set env.TZ="Asia/Seoul" --namespace kube-system
echo -e "http://$(kubectl get svc -n kube-system kube-ops-view -o jsonpath="{.status.loadBalancer.ingress[0].hostname}"):8080/#scale=1.5"
open "http://$(kubectl get svc -n kube-system kube-ops-view -o jsonpath="{.status.loadBalancer.ingress[0].hostname}"):8080/#scale=1.5"

# 혹은
## kubectl annotate service kube-ops-view -n kube-system "external-dns.alpha.kubernetes.io/hostname=kubeopsview.$MyDomain"
## echo -e "Kube Ops View URL = http://kubeopsview.$MyDomain:8080/#scale=1.5"
## open "http://kubeopsview.$MyDomain:8080/#scale=1.5"

# (옵션) ExternalDNS
## MyDomain=<자신의 도메인>
## MyDomain=gasida.link
## MyDnzHostedZoneId=$(aws route53 list-hosted-zones-by-name --dns-name "${MyDomain}." --query "HostedZones[0].Id" --output text)
## echo $MyDomain, $MyDnzHostedZoneId
## curl -s https://raw.githubusercontent.com/gasida/PKOS/main/aews/externaldns.yaml | MyDomain=$MyDomain MyDnzHostedZoneId=$MyDnzHostedZoneId envsubst | kubectl apply -f -
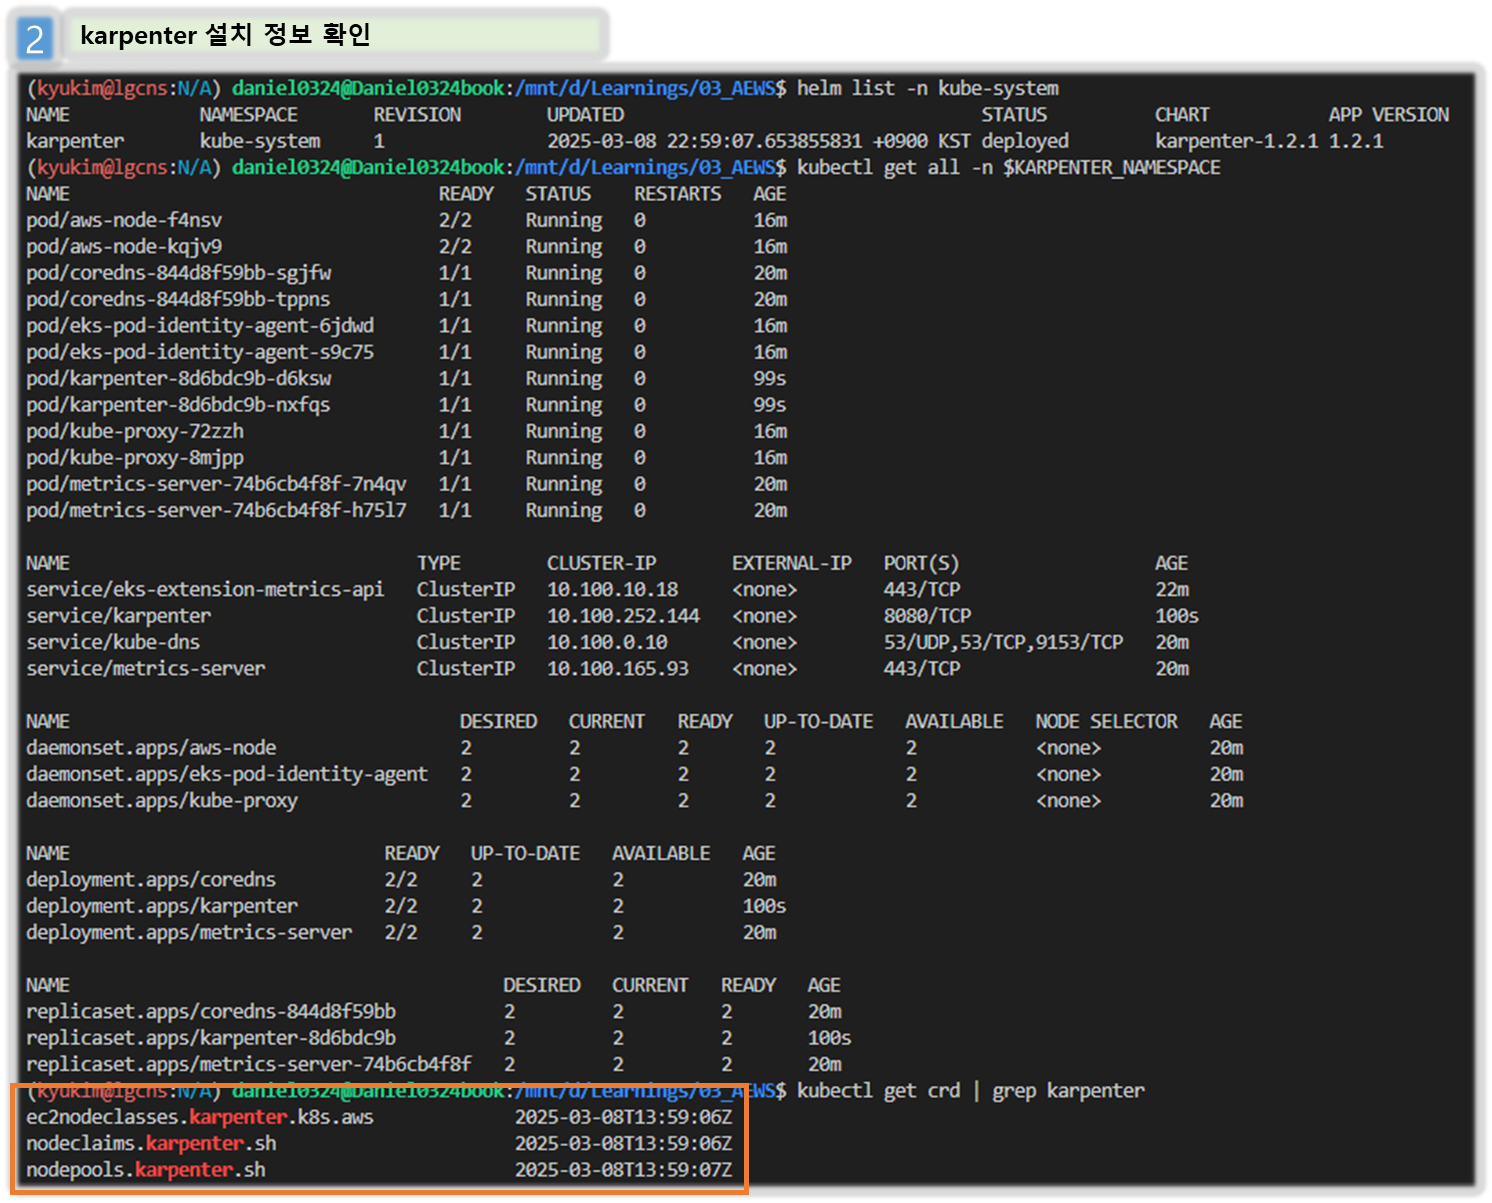
Step5. karpenter 설치
# Logout of helm registry to perform an unauthenticated pull against the public ECR
helm registry logout public.ecr.aws

# Karpenter 설치를 위한 변수 설정 및 확인
export CLUSTER_ENDPOINT="$(aws eks describe-cluster --name "${CLUSTER_NAME}" --query "cluster.endpoint" --output text)"
export KARPENTER_IAM_ROLE_ARN="arn:${AWS_PARTITION}:iam::${AWS_ACCOUNT_ID}:role/${CLUSTER_NAME}-karpenter"
echo "${CLUSTER_ENDPOINT} ${KARPENTER_IAM_ROLE_ARN}"

# karpenter 설치
helm upgrade --install karpenter oci://public.ecr.aws/karpenter/karpenter --version "${KARPENTER_VERSION}" --namespace "${KARPENTER_NAMESPACE}" --create-namespace \
  --set "settings.clusterName=${CLUSTER_NAME}" \
  --set "settings.interruptionQueue=${CLUSTER_NAME}" \
  --set controller.resources.requests.cpu=1 \
  --set controller.resources.requests.memory=1Gi \
  --set controller.resources.limits.cpu=1 \
  --set controller.resources.limits.memory=1Gi \
  --wait

# 확인
helm list -n kube-system
kubectl get-all -n $KARPENTER_NAMESPACE
kubectl get all -n $KARPENTER_NAMESPACE
kubectl get crd | grep karpenter
ec2nodeclasses.karpenter.k8s.aws             2025-03-02T06:11:47Z
nodeclaims.karpenter.sh                      2025-03-02T06:11:47Z
nodepools.karpenter.sh 2025-03-02T06:11:47Z- Karpenter는 ClusterFirst기본적으로 포드 DNS 정책을 사용합니다. Karpenter가 DNS 서비스 포드의 용량을 관리해야 하는 경우 Karpenter가 시작될 때 DNS가 실행되지 않음을 의미합니다. 이 경우 포드 DNS 정책을 Defaultwith 로 설정해야 합니다 --set dnsPolicy=Default. 이렇게 하면 Karpenter가 내부 DNS 확인 대신 호스트의 DNS 확인을 사용하도록 하여 실행할 DNS 서비스 포드에 대한 종속성이 없도록 합니다.
- Karpenter는 노드 용량 추적을 위해 클러스터의 CloudProvider 머신과 CustomResources 간의 매핑을 만듭니다. 이 매핑이 일관되도록 하기 위해 Karpenter는 다음 태그 키를 활용합니다.
- karpenter.sh/managed-by
- karpenter.sh/nodepool
- kubernetes.io/cluster/${CLUSTER_NAME}
[ 실행 결과 - 한 눈에 보기 ]

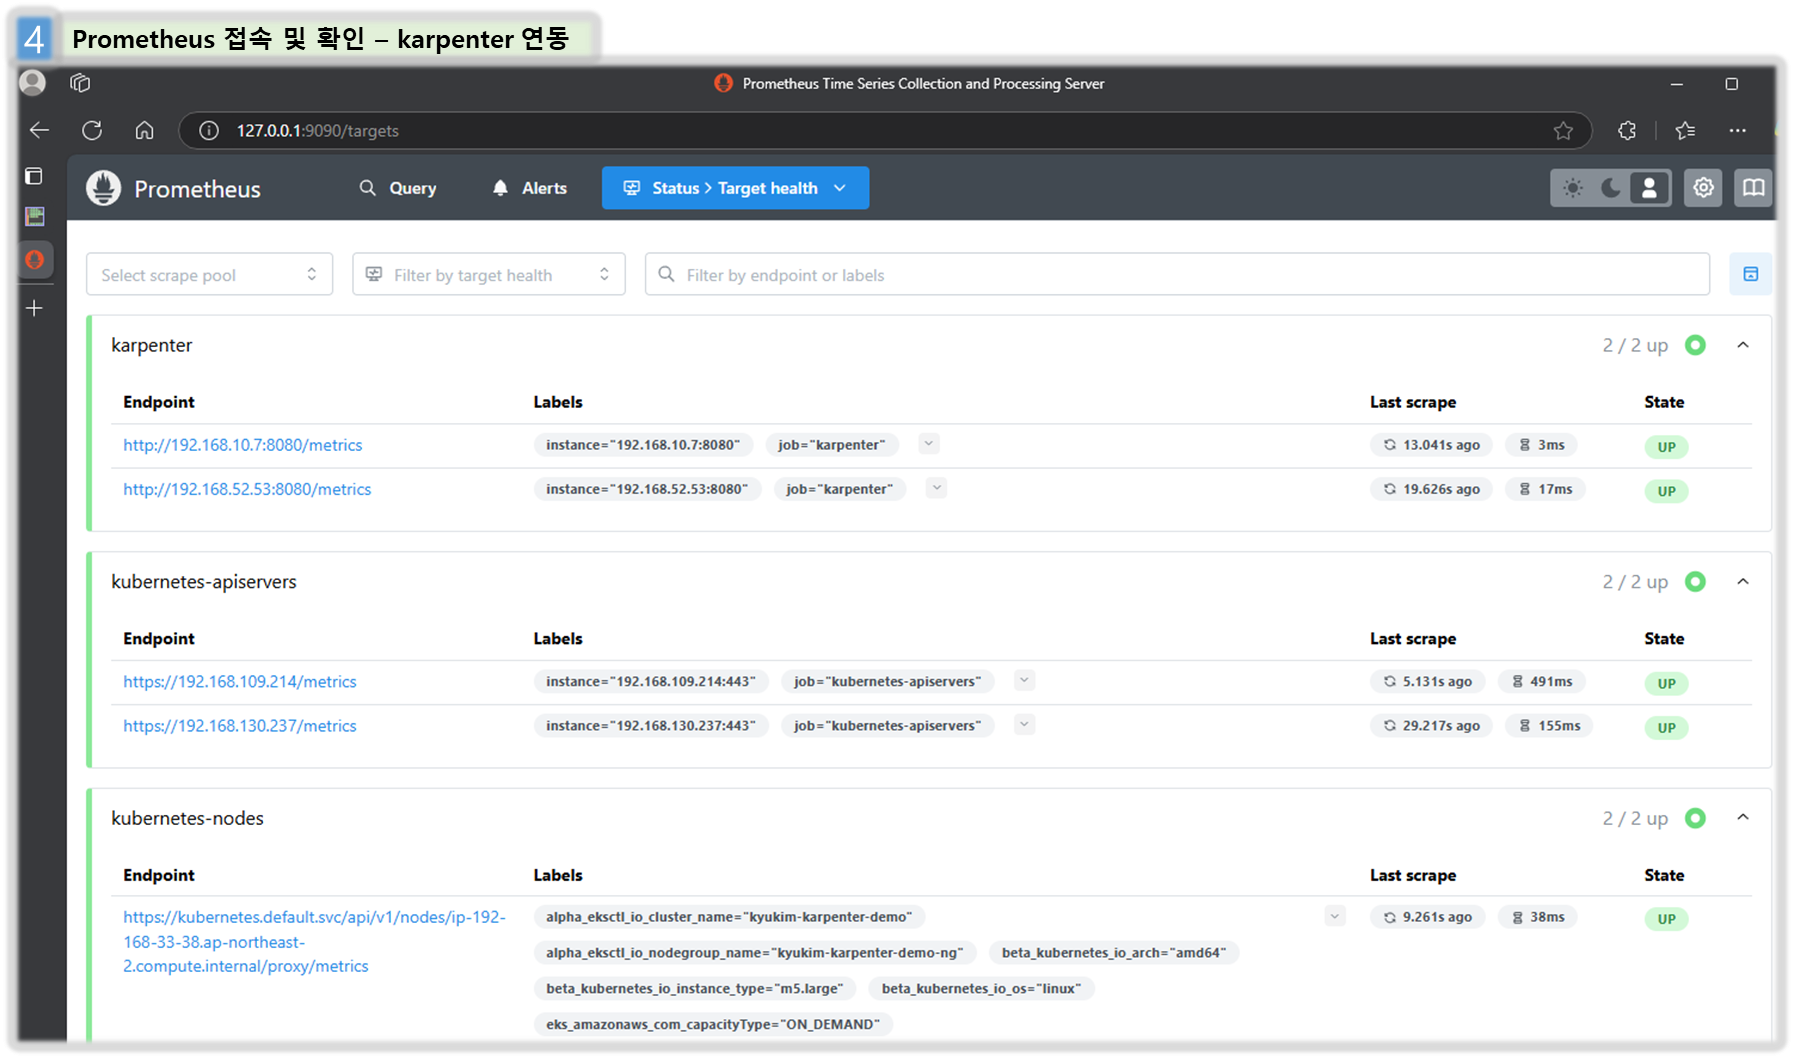
Step6. 프로메테우스 / 그라파나 설치 - Docs
#
helm repo add grafana-charts https://grafana.github.io/helm-charts
helm repo add prometheus-community https://prometheus-community.github.io/helm-charts
helm repo update
kubectl create namespace monitoring
# 프로메테우스 설치
curl -fsSL https://raw.githubusercontent.com/aws/karpenter-provider-aws/v"${KARPENTER_VERSION}"/website/content/en/preview/getting-started/getting-started-with-karpenter/prometheus-values.yaml | envsubst | tee prometheus-values.yaml
helm install --namespace monitoring prometheus prometheus-community/prometheus --values prometheus-values.yaml
extraScrapeConfigs: |
- job_name: karpenter
kubernetes_sd_configs:
- role: endpoints
namespaces:
names:
- kube-system
relabel_configs:
- source_labels:
- __meta_kubernetes_endpoints_name
- __meta_kubernetes_endpoint_port_name
action: keep
regex: karpenter;http-metrics
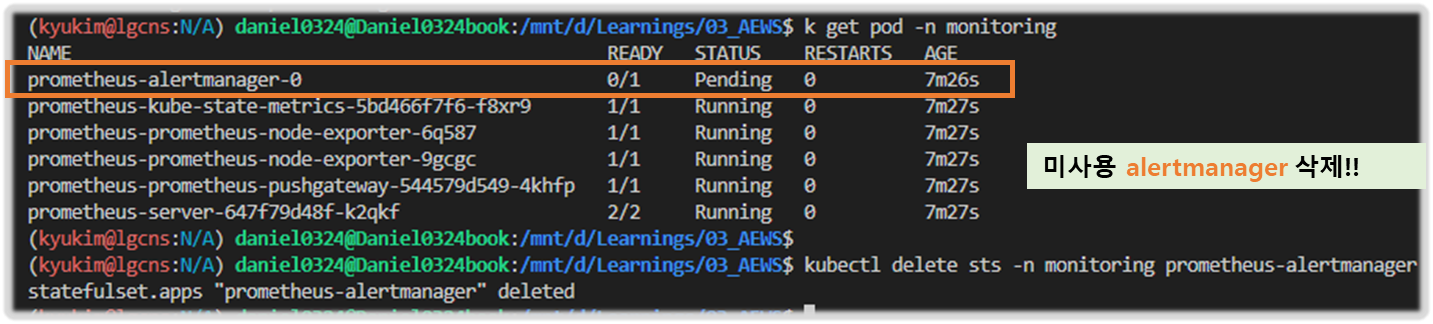
# 프로메테우스 얼럿매니저 미사용으로 삭제
kubectl delete sts -n monitoring prometheus-alertmanager
# 프로메테우스 접속 설정
export POD_NAME=$(kubectl get pods --namespace monitoring -l "app.kubernetes.io/name=prometheus,app.kubernetes.io/instance=prometheus" -o jsonpath="{.items[0].metadata.name}")
kubectl --namespace monitoring port-forward $POD_NAME 9090 &
open http://127.0.0.1:9090
# 그라파나 설치
curl -fsSL https://raw.githubusercontent.com/aws/karpenter-provider-aws/v"${KARPENTER_VERSION}"/website/content/en/preview/getting-started/getting-started-with-karpenter/grafana-values.yaml | tee grafana-values.yaml
helm install --namespace monitoring grafana grafana-charts/grafana --values grafana-values.yaml
datasources:
datasources.yaml:
apiVersion: 1
datasources:
- name: Prometheus
type: prometheus
version: 1
url: http://prometheus-server:80
access: proxy
dashboardProviders:
dashboardproviders.yaml:
apiVersion: 1
providers:
- name: 'default'
orgId: 1
folder: ''
type: file
disableDeletion: false
editable: true
options:
path: /var/lib/grafana/dashboards/default
dashboards:
default:
capacity-dashboard:
url: https://karpenter.sh/preview/getting-started/getting-started-with-karpenter/karpenter-capacity-dashboard.json
performance-dashboard:
url: https://karpenter.sh/preview/getting-started/getting-started-with-karpenter/karpenter-performance-dashboard.json
# admin 암호
kubectl get secret --namespace monitoring grafana -o jsonpath="{.data.admin-password}" | base64 --decode ; echo
17JUGSjgxK20m4NEnAaG7GzyBjqAMHMFxRnXItLj
# 그라파나 접속
kubectl port-forward --namespace monitoring svc/grafana 3000:80 &
open http://127.0.0.1:3000
[ 실행 결과 - 한 눈에 보기 ]


[ 참고 화면 ]

Step7. Create NodePool (구 Provisioner) - Workshop , Docs , NodeClaims
- 관리 리소스는 securityGroupSelector and subnetSelector로 찾음
- consolidationPolicy : 미사용 노드 정리 정책, 데몬셋 제외
- 단일 Karpenter NodePool은 여러 다른 포드 모양을 처리할 수 있습니다. Karpenter는 레이블 및 친화성과 같은 포드 속성을 기반으로 스케줄링 및 프로비저닝 결정을 내립니다. 즉, Karpenter는 여러 다른 노드 그룹을 관리할 필요성을 제거합니다.
- A single Karpenter NodePool is capable of handling many different pod shapes. Karpenter makes scheduling and provisioning decisions based on pod attributes such as labels and affinity. In other words, Karpenter eliminates the need to manage many different node groups.
- 아래 명령을 사용하여 기본 NodePool을 만듭니다. 이 NodePool은 노드를 시작하는 데 사용되는 리소스를 검색하기 위해 securityGroupSelectorTerms및 를 사용합니다. 위 명령 에서 subnetSelectorTerms태그를 적용했습니다 . 이러한 리소스가 클러스터 간에 공유되는 방식에 따라 다른 태그 지정 체계를 사용해야 할 수 있습니다.karpenter.sh/discovery
- Create a default NodePool using the command below. This NodePool uses securityGroupSelectorTerms and subnetSelectorTerms to discover resources used to launch nodes. We applied the tag karpenter.sh/discovery in the eksctl command above. Depending on how these resources are shared between clusters, you may need to use different tagging schemes.
- consolidationPolicy은 Karpenter가 노드를 제거하고 교체하여 클러스터 비용을 줄이도록 구성합니다. 결과적으로 통합은 클러스터의 모든 빈 노드를 종료합니다. 이 동작은 로 설정하여 Karpenter에게 노드를 통합해서는 안 된다고 말함으로써 비활성화할 수 있습니다 . 자세한 내용은 NodePool API 문서를 검토하세요.WhenEmptyOrUnderutilizeddisruptionconsolidateAfterNever
- The consolidationPolicy set to WhenEmptyOrUnderutilized in the disruption block configures Karpenter to reduce cluster cost by removing and replacing nodes. As a result, consolidation will terminate any empty nodes on the cluster. This behavior can be disabled by setting consolidateAfter to Never, telling Karpenter that it should never consolidate nodes. Review the NodePool API docs for more informatio
- 참고: 이 NodePool은 생성된 모든 용량의 합계가 지정된 한도보다 작은 한도 내에서 용량을 생성합니다.
- This NodePool will create capacity as long as the sum of all created capacity is less than the specified limit.
#
echo $ALIAS_VERSION
v20250228

#
cat <<EOF | envsubst | kubectl apply -f -
apiVersion: karpenter.sh/v1
kind: NodePool
metadata:
  name: default
spec:
  template:
    spec:
      requirements:
        - key: kubernetes.io/arch
          operator: In
          values: ["amd64"]
        - key: kubernetes.io/os
          operator: In
          values: ["linux"]
        - key: karpenter.sh/capacity-type
          operator: In
          values: ["on-demand"]
        - key: karpenter.k8s.aws/instance-category
          operator: In
          values: ["c", "m", "r"]
        - key: karpenter.k8s.aws/instance-generation
          operator: Gt
          values: ["2"]
      nodeClassRef:
        group: karpenter.k8s.aws
        kind: EC2NodeClass
        name: default
      expireAfter: 720h # 30 * 24h = 720h
  limits:
    cpu: 1000
  disruption:
    consolidationPolicy: WhenEmptyOrUnderutilized
    consolidateAfter: 1m
---
apiVersion: karpenter.k8s.aws/v1
kind: EC2NodeClass
metadata:
  name: default
spec:
  role: "KarpenterNodeRole-${CLUSTER_NAME}" # replace with your cluster name
  amiSelectorTerms:
    - alias: "al2023@${ALIAS_VERSION}" # ex) al2023@latest
  subnetSelectorTerms:
    - tags:
        karpenter.sh/discovery: "${CLUSTER_NAME}" # replace with your cluster name
  securityGroupSelectorTerms:
    - tags:
        karpenter.sh/discovery: "${CLUSTER_NAME}" # replace with your cluster name
EOF

# 확인
kubectl get nodepool,ec2nodeclass,nodeclaims- Karpenter is now active and ready to begin provisioning nodes.

Step8. Scale up deployment : This deployment uses the pause image and starts with zero replicas.
1) Scale up deployment

# pause 파드 1개에 CPU 1개 최소 보장 할당할 수 있게 디플로이먼트 배포
cat <<EOF | kubectl apply -f -
apiVersion: apps/v1
kind: Deployment
metadata:
  name: inflate
spec:
  replicas: 0
  selector:
    matchLabels:
      app: inflate
  template:
    metadata:
      labels:
        app: inflate
    spec:
      terminationGracePeriodSeconds: 0
      securityContext:
        runAsUser: 1000
        runAsGroup: 3000
        fsGroup: 2000
      containers:
      - name: inflate
        image: public.ecr.aws/eks-distro/kubernetes/pause:3.7
        resources:
          requests:
            cpu: 1
        securityContext:
          allowPrivilegeEscalation: false
EOF

# [신규 터미널] 모니터링
eks-node-viewer --resources cpu,memory
eks-node-viewer --resources cpu,memory --node-selector "karpenter.sh/registered=true" --extra-labels eks-node-viewer/node-age


# Scale up
kubectl get pod
kubectl scale deployment inflate --replicas 5

# 출력 로그 분석해보자!
kubectl logs -f -n "${KARPENTER_NAMESPACE}" -l app.kubernetes.io/name=karpenter -c controller
kubectl logs -f -n "${KARPENTER_NAMESPACE}" -l app.kubernetes.io/name=karpenter -c controller | jq '.'
kubectl logs -n "${KARPENTER_NAMESPACE}" -l app.kubernetes.io/name=karpenter -c controller | grep 'launched nodeclaim' | jq '.'
{
  "level": "INFO",
  "time": "2025-03-02T07:43:14.316Z",
  "logger": "controller",
  "message": "launched nodeclaim",
  "commit": "058c665",
  "controller": "nodeclaim.lifecycle",
  "controllerGroup": "karpenter.sh",
  "controllerKind": "NodeClaim",
  "NodeClaim": {
    "name": "default-x7ntc"
  },
  "namespace": "",
  "name": "default-x7ntc",
  "reconcileID": "51854f39-e885-45a5-895c-e55a15b160f0",
  "provider-id": "aws:///ap-northeast-2c/i-062705e52143939a6",
  "instance-type": "c5a.2xlarge",
  "zone": "ap-northeast-2c",
  "capacity-type": "on-demand",
  "allocatable": {
    "cpu": "7910m",
    "ephemeral-storage": "17Gi",
    "memory": "14162Mi",
    "pods": "58",
    "vpc.amazonaws.com/pod-eni": "38"
  }
}

# 확인
kubectl get nodeclaims
NAME            TYPE          CAPACITY    ZONE              NODE                                                 READY   AGE
default-8f5vd   c5a.2xlarge   on-demand   ap-northeast-2c   ip-192-168-176-171.ap-northeast-2.compute.internal   True    79s

kubectl describe nodeclaims
...
Spec:
  Expire After:  720h
  Node Class Ref:
    Group:  karpenter.k8s.aws
    Kind:   EC2NodeClass
    Name:   default
  Requirements:
    Key:       karpenter.k8s.aws/instance-category
    Operator:  In
    Values:
      c
      m
      r
    Key:       node.kubernetes.io/instance-type
    Operator:  In
    Values:
      c4.2xlarge
      c4.4xlarge
      c5.2xlarge
      c5.4xlarge
      c5a.2xlarge
      c5a.4xlarge
      c5a.8xlarge
      c5d.2xlarge
      c5d.4xlarge
      ...
    ...
    Key:       karpenter.sh/capacity-type
    Operator:  In
    Values:
      on-demand
  Resources:
    Requests:
      Cpu:   4150m
      Pods:  8
Status:
  Allocatable:
    Cpu:                        7910m
    Ephemeral - Storage:        17Gi
    Memory:                     14162Mi
    Pods:                       58
    vpc.amazonaws.com/pod-eni:  38
  Capacity:
    Cpu:                        8
    Ephemeral - Storage:        20Gi
    Memory:                     15155Mi
    Pods:                       58
    vpc.amazonaws.com/pod-eni:  38
...

#
kubectl get node -l karpenter.sh/registered=true -o jsonpath="{.items[0].metadata.labels}" | jq '.'
...
  "karpenter.sh/initialized": "true",
  "karpenter.sh/nodepool": "default",
  "karpenter.sh/registered": "true",
...

# (옵션) 더욱 더 Scale up!
kubectl scale deployment inflate --replicas 30
- CreateFleet 이벤트 확인 - Link

[ 참고 - 프로메테우스 Metric 검색 : karpenter_XXX ]

[ 실행 결과 - 한 눈에 보기 ]


Step9. Scale Down deployment

# Now, delete the deployment. After a short amount of time, Karpenter should terminate the empty nodes due to consolidation.
kubectl delete deployment inflate && date
# 출력 로그 분석해보자!
kubectl logs -f -n "${KARPENTER_NAMESPACE}" -l app.kubernetes.io/name=karpenter -c controller | jq '.'
...
{
  "level": "INFO",
  "time": "2025-03-02T06:53:28.780Z",
  "logger": "controller",
  "message": "disrupting nodeclaim(s) via delete, terminating 1 nodes (1 pods) ip-192-168-131-97.ap-northeast-2.compute.internal/c5a.large/on-demand",
  "commit": "058c665",
  "controller": "disruption",
  "namespace": "",
  "name": "",
  "reconcileID": "86a3a45c-2604-4a71-808a-21290301d096",
  "command-id": "51914aee-4e09-436f-af6d-794163c3d1c2",
  "reason": "underutilized"
}
{
  "level": "INFO",
  "time": "2025-03-02T06:53:29.532Z",
  "logger": "controller",
  "message": "tainted node",
  "commit": "058c665",
  "controller": "node.termination",
  "controllerGroup": "",
  "controllerKind": "Node",
  "Node": {
    "name": "ip-192-168-131-97.ap-northeast-2.compute.internal"
  },
  "namespace": "",
  "name": "ip-192-168-131-97.ap-northeast-2.compute.internal",
  "reconcileID": "617bcb4d-5498-44d9-ba1e-6c8b7d97c405",
  "taint.Key": "karpenter.sh/disrupted",
  "taint.Value": "",
  "taint.Effect": "NoSchedule"
}
{
  "level": "INFO",
  "time": "2025-03-02T06:54:03.234Z",
  "logger": "controller",
  "message": "deleted node",
  "commit": "058c665",
  "controller": "node.termination",
  "controllerGroup": "",
  "controllerKind": "Node",
  "Node": {
    "name": "ip-192-168-131-97.ap-northeast-2.compute.internal"
  },
  "namespace": "",
  "name": "ip-192-168-131-97.ap-northeast-2.compute.internal",
  "reconcileID": "8c71fb19-b7ae-4037-afef-fbf1c7343f84"
}
{
  "level": "INFO",
  "time": "2025-03-02T06:54:03.488Z",
  "logger": "controller",
  "message": "deleted nodeclaim",
  "commit": "058c665",
  "controller": "nodeclaim.lifecycle",
  "controllerGroup": "karpenter.sh",
  "controllerKind": "NodeClaim",
  "NodeClaim": {
    "name": "default-mfkgp"
  },
  "namespace": "",
  "name": "default-mfkgp",
  "reconcileID": "757b4d88-2bf2-412c-bf83-3149f9517d85",
  "Node": {
    "name": "ip-192-168-131-97.ap-northeast-2.compute.internal"
  },
  "provider-id": "aws:///ap-northeast-2a/i-00f22c8bde3faf646"
}
{
  "level": "INFO",
  "time": "2025-03-02T07:25:55.661Z",
  "logger": "controller",
  "message": "disrupting nodeclaim(s) via delete, terminating 1 nodes (0 pods) ip-192-168-176-171.ap-northeast-2.compute.internal/c5a.2xlarge/on-demand",
  "commit": "058c665",
  "controller": "disruption",
  "namespace": "",
  "name": "",
  "reconcileID": "0942417e-7ecb-437a-85db-adc553ccade9",
  "command-id": "b2b7c689-91ca-43c5-ac1c-2052bf7418c1",
  "reason": "empty"
}
{
  "level": "INFO",
  "time": "2025-03-02T07:25:56.783Z",
  "logger": "controller",
  "message": "tainted node",
  "commit": "058c665",
  "controller": "node.termination",
  "controllerGroup": "",
  "controllerKind": "Node",
  "Node": {
    "name": "ip-192-168-176-171.ap-northeast-2.compute.internal"
  },
  "namespace": "",
  "name": "ip-192-168-176-171.ap-northeast-2.compute.internal",
  "reconcileID": "6254e6be-2445-4402-b829-0bb75fa540e0",
  "taint.Key": "karpenter.sh/disrupted",
  "taint.Value": "",
  "taint.Effect": "NoSchedule"
}
{
  "level": "INFO",
  "time": "2025-03-02T07:26:49.195Z",
  "logger": "controller",
  "message": "deleted node",
  "commit": "058c665",
  "controller": "node.termination",
  "controllerGroup": "",
  "controllerKind": "Node",
  "Node": {
    "name": "ip-192-168-176-171.ap-northeast-2.compute.internal"
  },
  "namespace": "",
  "name": "ip-192-168-176-171.ap-northeast-2.compute.internal",
  "reconcileID": "6c126a63-8bfa-4828-8ef6-5d22b8c1e7cc"
}

#
kubectl get nodeclaims
- TerminateInstances 최근 1시간 이벤트 확인 - Link

[ 실행 결과 - 한 눈에 보기 ]
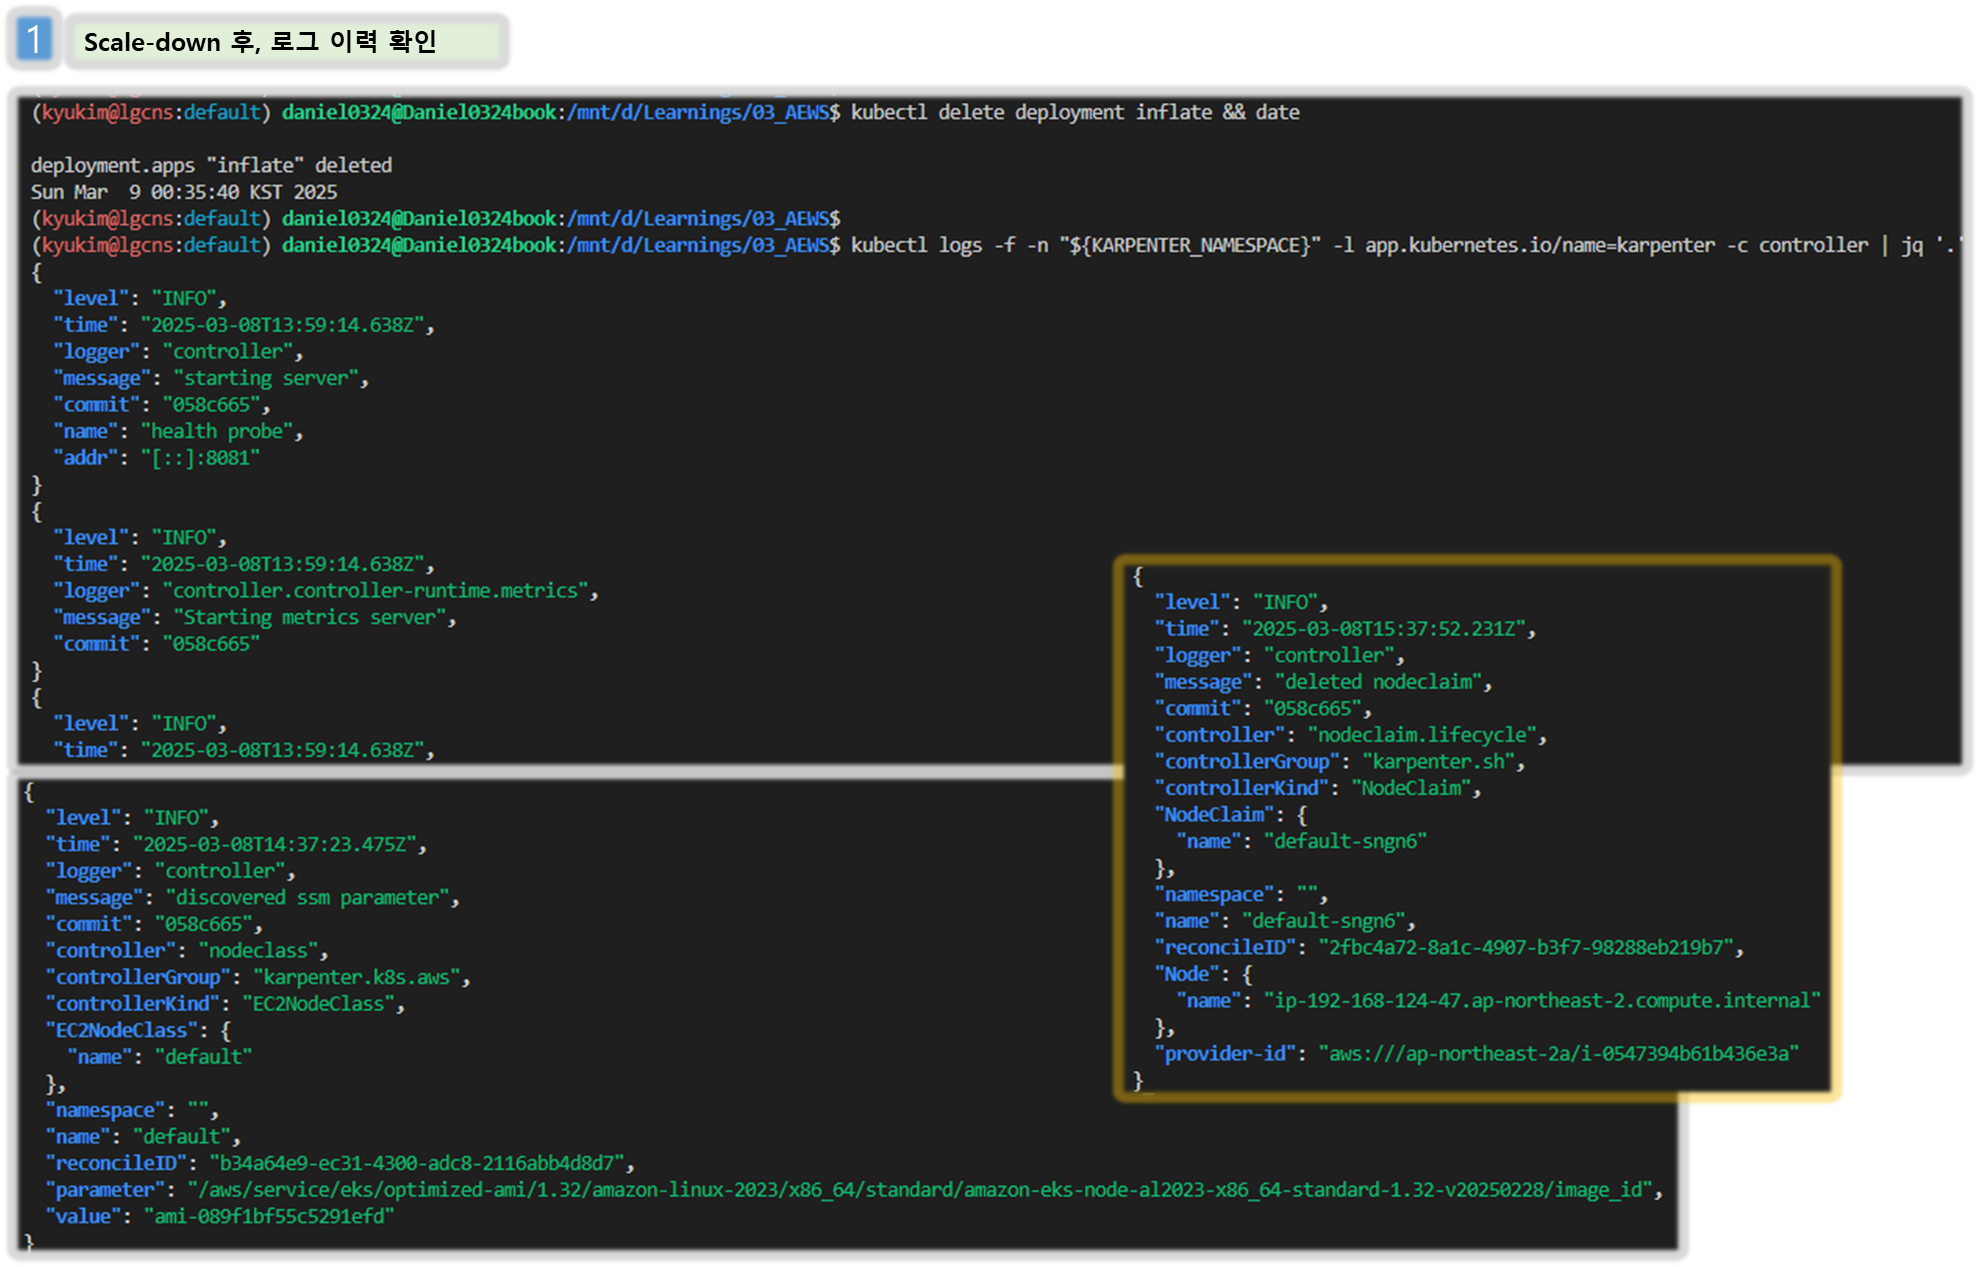


▶ Disruption (구 Consolidation) : Expiration , Drift , Consolidation - Workshop , Docs , Spot-to-Spot
[ 동작 이해 ]

- Expiration 만료 : 기본 720시간(30일) 후 인스턴스를 자동으로 만료하여 강제로 노드를 최신 상태로 유지
- Drift 드리프트 : 구성 변경 사항(NodePool, EC2NodeClass)를 감지하여 필요한 변경 사항을 적용
- Consolidation 통합 : 비용 효율적인 컴퓨팅 최적화 선택
- A critical feature for operating compute in a cost-effective manner, Karpenter will optimize our cluster's compute on an on-going basis. For example, if workloads are running on under-utilized compute instances, it will consolidate them to fewer instances.
- 스팟 인스턴스 시작 시 Karpenter는 AWS EC2 Fleet Instance API를 호출하여 NodePool 구성 기반으로 선택한 인스턴스 유형을 전달.
- AWS EC2 Fleet Instance API는 시작된 인스턴스 목록과 시작할 수 없는 인스턴스 목록을 즉시 반환하는 API로, 시작할 수 없을 경우 Karpenter는 대체 용량을 요청하거나 워크로드에 대한 soft 일정 제약 조건을 제거할 수 있음

- Spot-to-Spot Consolidation 에는 주문형 통합과 다른 접근 방식이 필요했습니다. 온디맨드 통합의 경우 규모 조정 및 최저 가격이 주요 지표로 사용됩니다.
- 스팟 간 통합이 이루어지려면 Karpenter에는 최소 15개의 인스턴스 유형이 포함된 다양한 인스턴스 구성(연습에 정의된 NodePool 예제 참조)이 필요합니다. 이러한 제약 조건이 없으면 Karpenter가 가용성이 낮고 중단 빈도가 높은 인스턴스를 선택할 위험이 있습니다.
# 기존 nodepool 삭제
kubectl delete nodepool,ec2nodeclass default

# 모니터링
kubectl logs -f -n "${KARPENTER_NAMESPACE}" -l app.kubernetes.io/name=karpenter -c controller | jq '.'
eks-node-viewer --resources cpu,memory --node-selector "karpenter.sh/registered=true" --extra-labels eks-node-viewer/node-age
watch -d "kubectl get nodes -L karpenter.sh/nodepool -L node.kubernetes.io/instance-type -L karpenter.sh/capacity-type"

# Create a Karpenter NodePool and EC2NodeClass
cat <<EOF | envsubst | kubectl apply -f -
apiVersion: karpenter.sh/v1
kind: NodePool
metadata:
  name: default
spec:
  template:
    spec:
      nodeClassRef:
        group: karpenter.k8s.aws
        kind: EC2NodeClass
        name: default
      requirements:
        - key: kubernetes.io/os
          operator: In
          values: ["linux"]
        - key: karpenter.sh/capacity-type
          operator: In
          values: ["on-demand"]
        - key: karpenter.k8s.aws/instance-category
          operator: In
          values: ["c", "m", "r"]
        - key: karpenter.k8s.aws/instance-size
          operator: NotIn
          values: ["nano","micro","small","medium"]
        - key: karpenter.k8s.aws/instance-hypervisor
          operator: In
          values: ["nitro"]
      expireAfter: 1h # nodes are terminated automatically after 1 hour
  limits:
    cpu: "1000"
    memory: 1000Gi
  disruption:
    consolidationPolicy: WhenEmptyOrUnderutilized # policy enables Karpenter to replace nodes when they are either empty or underutilized
    consolidateAfter: 1m
---
apiVersion: karpenter.k8s.aws/v1
kind: EC2NodeClass
metadata:
  name: default
spec:
  role: "KarpenterNodeRole-${CLUSTER_NAME}" # replace with your cluster name
  amiSelectorTerms:
    - alias: "al2023@latest"
  subnetSelectorTerms:
    - tags:
        karpenter.sh/discovery: "${CLUSTER_NAME}" # replace with your cluster name
  securityGroupSelectorTerms:
    - tags:
        karpenter.sh/discovery: "${CLUSTER_NAME}" # replace with your cluster name
EOF

# 확인
kubectl get nodepool,ec2nodeclass

# Deploy a sample workload
cat <<EOF | kubectl apply -f -
apiVersion: apps/v1
kind: Deployment
metadata:
  name: inflate
spec:
  replicas: 5
  selector:
    matchLabels:
      app: inflate
  template:
    metadata:
      labels:
        app: inflate
    spec:
      terminationGracePeriodSeconds: 0
      securityContext:
        runAsUser: 1000
        runAsGroup: 3000
        fsGroup: 2000
      containers:
      - name: inflate
        image: public.ecr.aws/eks-distro/kubernetes/pause:3.7
        resources:
          requests:
            cpu: 1
            memory: 1.5Gi
        securityContext:
          allowPrivilegeEscalation: false
EOF


#
kubectl get nodes -L karpenter.sh/nodepool -L node.kubernetes.io/instance-type -L karpenter.sh/capacity-type
kubectl get nodeclaims
kubectl describe nodeclaims
kubectl logs -f -n "${KARPENTER_NAMESPACE}" -l app.kubernetes.io/name=karpenter -c controller | jq '.'
kubectl logs -n "${KARPENTER_NAMESPACE}" -l app.kubernetes.io/name=karpenter -c controller | grep 'launched nodeclaim' | jq '.'


# Scale the inflate workload from 5 to 12 replicas, triggering Karpenter to provision additional capacity
kubectl scale deployment/inflate --replicas 12

# This changes the total memory request for this deployment to around 12Gi,
# which when adjusted to account for the roughly 600Mi reserved for the kubelet on each node means that this will fit on 2 instances of type m5.large:
kubectl get nodeclaims


# Scale down the workload back down to 5 replicas
kubectl scale deployment/inflate --replicas 5
kubectl get nodeclaims
NAME            TYPE          CAPACITY    ZONE              NODE                                                 READY   AGE
default-ffnzp   c6g.2xlarge   on-demand   ap-northeast-2c   ip-192-168-185-240.ap-northeast-2.compute.internal   True    14m


# We can check the Karpenter logs to get an idea of what actions it took in response to our scaling in the deployment. Wait about 5-10 seconds before running the following command:
kubectl logs -f -n "${KARPENTER_NAMESPACE}" -l app.kubernetes.io/name=karpenter -c controller | jq '.'
{
  "level": "INFO",
  "time": "2025-03-02T08:19:13.969Z",
  "logger": "controller",
  "message": "disrupting nodeclaim(s) via delete, terminating 1 nodes (5 pods) ip-192-168-132-48.ap-northeast-2.compute.internal/c6g.2xlarge/on-demand",
  "commit": "058c665",
  "controller": "disruption",
  "namespace": "",
  "name": "",
  "reconcileID": "a900df38-7189-42aa-a3b3-9fcaf944dcf4",
  "command-id": "4b7ef3a5-6962-48a9-bd38-c9898580bb75",
  "reason": "underutilized"
}


# Karpenter can also further consolidate if a node can be replaced with a cheaper variant in response to workload changes.
# This can be demonstrated by scaling the inflate deployment replicas down to 1, with a total memory request of around 1Gi:
kubectl scale deployment/inflate --replicas 1

kubectl logs -f -n "${KARPENTER_NAMESPACE}" -l app.kubernetes.io/name=karpenter -c controller | jq '.'
{
  "level": "INFO",
  "time": "2025-03-02T08:23:59.683Z",
  "logger": "controller",
  "message": "disrupting nodeclaim(s) via replace, terminating 1 nodes (1 pods) ip-192-168-185-240.ap-northeast-2.compute.internal/c6g.2xlarge/on-demand and replacing with on-demand node from types c6g.large, c7g.large, c5a.large, c6gd.large, m6g.large and 55 other(s)",
  "commit": "058c665",
  "controller": "disruption",
  "namespace": "",
  "name": "",
  "reconcileID": "6669c544-e065-4c97-b594-ec1fb68b68b5",
  "command-id": "b115c17f-3e29-48bc-8da8-d7073f189624",
  "reason": "underutilized"
}

kubectl get nodeclaims
NAME            TYPE          CAPACITY    ZONE              NODE                                                 READY   AGE
default-ff7xn   c6g.large     on-demand   ap-northeast-2b   ip-192-168-109-5.ap-northeast-2.compute.internal     True    78s
default-ffnzp   c6g.2xlarge   on-demand   ap-northeast-2c   ip-192-168-185-240.ap-northeast-2.compute.internal   True    16m

kubectl get nodeclaims
NAME            TYPE        CAPACITY    ZONE              NODE                                               READY   AGE
default-ff7xn   c6g.large   on-demand   ap-northeast-2b   ip-192-168-109-5.ap-northeast-2.compute.internal   True    3m3s


# 삭제
kubectl delete deployment inflate
kubectl delete nodepool,ec2nodeclass default
▶ (추가 실습) Spot-to-Spot Consolidation 실습 해보기
# v0.34.0 부터 featureGates 에 spotToSpotConsolidation 활성화로 사용 가능
## helm upgrade karpenter -n kube-system oci://public.ecr.aws/karpenter/karpenter --reuse-values --set settings.featureGates.spotToSpotConsolidation=true

# 모니터링
kubectl logs -f -n "${KARPENTER_NAMESPACE}" -l app.kubernetes.io/name=karpenter -c controller | jq '.'
eks-node-viewer --resources cpu,memory --node-selector "karpenter.sh/registered=true"

# Create a Karpenter NodePool and EC2NodeClass
cat <<EOF | envsubst | kubectl apply -f -
apiVersion: karpenter.sh/v1
kind: NodePool
metadata:
  name: default
spec:
  template:
    spec:
      nodeClassRef:
        group: karpenter.k8s.aws
        kind: EC2NodeClass
        name: default
      requirements:
        - key: kubernetes.io/os
          operator: In
          values: ["linux"]
        - key: karpenter.sh/capacity-type
          operator: In
          values: ["spot"]
        - key: karpenter.k8s.aws/instance-category
          operator: In
          values: ["c", "m", "r"]
        - key: karpenter.k8s.aws/instance-size
          operator: NotIn
          values: ["nano","micro","small","medium"]
        - key: karpenter.k8s.aws/instance-hypervisor
          operator: In
          values: ["nitro"]
      expireAfter: 1h # nodes are terminated automatically after 1 hour
  limits:
    cpu: "1000"
    memory: 1000Gi
  disruption:
    consolidationPolicy: WhenEmptyOrUnderutilized # policy enables Karpenter to replace nodes when they are either empty or underutilized
    consolidateAfter: 1m
---
apiVersion: karpenter.k8s.aws/v1
kind: EC2NodeClass
metadata:
  name: default
spec:
  role: "KarpenterNodeRole-${CLUSTER_NAME}" # replace with your cluster name
  amiSelectorTerms:
    - alias: "bottlerocket@latest"
  subnetSelectorTerms:
    - tags:
        karpenter.sh/discovery: "${CLUSTER_NAME}" # replace with your cluster name
  securityGroupSelectorTerms:
    - tags:
        karpenter.sh/discovery: "${CLUSTER_NAME}" # replace with your cluster name
EOF

# 확인
kubectl get nodepool,ec2nodeclass

# Deploy a sample workload
cat <<EOF | kubectl apply -f -
apiVersion: apps/v1
kind: Deployment
metadata:
  name: inflate
spec:
  replicas: 5
  selector:
    matchLabels:
      app: inflate
  template:
    metadata:
      labels:
        app: inflate
    spec:
      terminationGracePeriodSeconds: 0
      securityContext:
        runAsUser: 1000
        runAsGroup: 3000
        fsGroup: 2000
      containers:
      - name: inflate
        image: public.ecr.aws/eks-distro/kubernetes/pause:3.7
        resources:
          requests:
            cpu: 1
            memory: 1.5Gi
        securityContext:
          allowPrivilegeEscalation: false
EOF

#
kubectl get nodes -L karpenter.sh/nodepool -L node.kubernetes.io/instance-type -L karpenter.sh/capacity-type
kubectl get nodeclaims
kubectl describe nodeclaims
kubectl logs -f -n "${KARPENTER_NAMESPACE}" -l app.kubernetes.io/name=karpenter -c controller | jq '.'
kubectl logs -n "${KARPENTER_NAMESPACE}" -l app.kubernetes.io/name=karpenter -c controller | grep 'launched nodeclaim' | jq '.'

# Scale the inflate workload from 5 to 12 replicas, triggering Karpenter to provision additional capacity
kubectl scale deployment/inflate --replicas 12

# This changes the total memory request for this deployment to around 12Gi,
# which when adjusted to account for the roughly 600Mi reserved for the kubelet on each node means that this will fit on 2 instances of type m5.large:
kubectl get nodeclaims

# Scale down the workload back down to 5 replicas
kubectl scale deployment/inflate --replicas 5
kubectl get nodeclaims

# We can check the Karpenter logs to get an idea of what actions it took in response to our scaling in the deployment. Wait about 5-10 seconds before running the following command:
kubectl logs -f -n "${KARPENTER_NAMESPACE}" -l app.kubernetes.io/name=karpenter -c controller | jq '.'

# Karpenter can also further consolidate if a node can be replaced with a cheaper variant in response to workload changes.
# This can be demonstrated by scaling the inflate deployment replicas down to 1, with a total memory request of around 1Gi:
kubectl scale deployment/inflate --replicas 1
kubectl logs -f -n "${KARPENTER_NAMESPACE}" -l app.kubernetes.io/name=karpenter -c controller | jq '.'
kubectl get nodeclaims

# 삭제
kubectl delete deployment inflate
kubectl delete nodepool,ec2nodeclass default
[ 실습 리소스 삭제 - Docs ]
# Karpenter helm 삭제
helm uninstall karpenter --namespace "${KARPENTER_NAMESPACE}"

# Karpenter IAM Role 등 생성한 CloudFormation 삭제
aws cloudformation delete-stack --stack-name "Karpenter-${CLUSTER_NAME}"

# EC2 Launch Template 삭제
aws ec2 describe-launch-templates --filters "Name=tag:karpenter.k8s.aws/cluster,Values=${CLUSTER_NAME}" |
    jq -r ".LaunchTemplates[].LaunchTemplateName" |
    xargs -I{} aws ec2 delete-launch-template --launch-template-name {}

# 클러스터 삭제
eksctl delete cluster --name "${CLUSTER_NAME}"
[ 마무리 ]
이번 실습과정을 통해, karpenter 의 동작원리 이해와 기존 EKS에서 사용하는 CAS 등과 비교해 볼 수 있는 좋은 기회가 되었던 것 같다. 코드 세팅 오류로 중간에 좀 애를 먹었지만, 후속 과정에서 그만큼 실수가 줄어 들 거라 기대해 본다.
비용관리 측면에서 kapenter 를 기반으로 한 접근점들이 상당히 많고, 시간을 가지고 버전 별 new-feature 도 더 들여다 보아야 겠다는 생각이 든다.
[ 참고 링크 모음 ]
[ 주요 기술이해 관련 ]
- 카펜터
- https://karpenter.sh/docs/
- https://docs.aws.amazon.com/eks/latest/best-practices/karpenter.html
- https://www.eksworkshop.com/docs/autoscaling/compute/karpenter/configure
- https://catalog.workshops.aws/karpenter/en-US
- https://catalog.us-east-1.prod.workshops.aws/workshops/f6b4587e-b8a5-4a43-be87-26bd85a70aba/en-US
- [EKS Workshop] AutoScaling : https://www.eksworkshop.com/docs/autoscaling/
- K8S Autoscaler - Github
- AWS Kr Blog
- Karpenter 소개 : 오픈 소스 고성능 Kubernetes 클러스터 오토스케일러 - 링크
- Karpenter 통합을 이용한 Kubernetes 컴퓨팅 비용 최적화 - 링크
- Karpenter Drift를 사용하여 Amazon EKS 워커 노드를 업그레이드하기 - Link
- Applying Spot-to-Spot consolidation best practices with Karpenter - Link
- Amazon Managed Service for Prometheus 메트릭을 활용해 KEDA로 쿠버네티스 워크로드 오토스케일링하기 - Link
- AWS Event
- AWS re:Invent 2024 - Simplify Kubernetes workloads with Karpenter & Amazon EKS Auto Mode (KUB312) - Link
- AWS re:Invent 2024 - Run workloads efficiently on EKS with Karpenter and EC2 Spot Instances (CMP213) - Link
- AWS re:Invent 2023 - Harness the power of Karpenter to scale, optimize & upgrade Kubernetes (CON331) - Link
- AWS Blog
- Migrating from x86 to AWS Graviton on Amazon EKS using Karpenter - Link
- Announcing Karpenter 1.0 - Link
- How Upstox built NextGen trading platform using Amazon EKS, Karpenter, and spot instances - Link
- Using Amazon EC2 Spot Instances with Karpenter - Link
- How Grover saves costs with 80% Spot in production using Karpenter with Amazon EKS - Link
- Scalable and Cost-Effective Event-Driven Workloads with KEDA and Karpenter on Amazon EKS - Link
- Deliver Namespace as a Service multi tenancy for Amazon EKS using Karpenter - Link
- Karpenter graduates to beta - Link
- Manage scale-to-zero scenarios with Karpenter and Serverless - Link
- How to upgrade Amazon EKS worker nodes with Karpenter Drift - Link
- Scaling Kubernetes with Karpenter: Advanced Scheduling with Pod Affinity and Volume Topology Awareness - 링크
- Managing Pod Scheduling Constraints and Groupless Node Upgrades with Karpenter in Amazon EKS - 링크
- Proactive autoscaling of Kubernetes workloads with KEDA and Amazon CloudWatch - 링크
- Introducing Karpenter – An Open-Source High-Performance Kubernetes Cluster Autoscaler - 링크
- KRR 소개 https://github.com/robusta-dev/krr , https://www.youtube.com/watch?v=v-e8gMvz6yQ
- Simkube Karpenter
[ 요소 기술 관련 Blog 및 참고자료 ]
1) Auto Scaling 그림 소개 1 : 출처 - (🧝🏻♂️)김태민 기술 블로그 - 링크
☞ K8S 오토스케일링 3가지 : HPA(Scale In/Out), VPA(Scale Up/Down), CA(노드 레벨)

아래 그림 출처 : https://www.oreilly.com/library/view/production-kubernetes/9781492092292/ch01.html
Production Kubernetes
Chapter 1. A Path to Production Over the years, the world has experienced wide adoption of Kubernetes within organizations. Its popularity has unquestionably been accelerated by the proliferation of containerized … - Selection from Production Kubernetes
www.oreilly.com
- Workload Autoscaling - Horizontal Pod Autoscaler
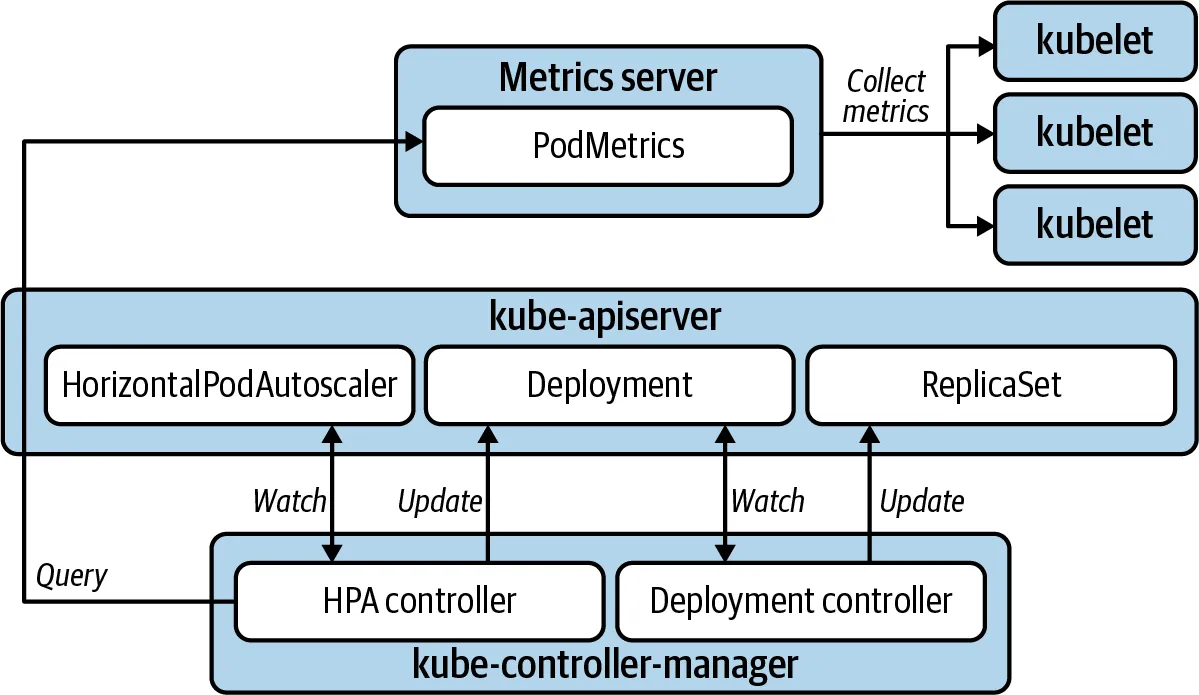
- Workload Autoscaling - Vertical Pod Autoscaler

- Workload Autoscaling - Vertical Pod Autoscaler

- HPA 아키텍처 : cAdvisor 이 컨테이너의 메모리/CPU 수집 → metrics-server 는 kubelet 를 통해서 수집 후 apiserver 에 등록 → HPA는 apiserver(Resource API)를 통해서 15초 마다 메모리/CPU 수집하여 정책에 따라 동작

- metrics.type(Resource, Pods, Object), target.type(Utilization, AverageValue, Value)

2) Auto Scaling 그림 소개 2 : k8s 관련 책 발췌
- HPA


- 파드(디플로이먼트) 롤링 업데이트 전략

- KEDA

- VPA

- CAS


3) Resource Management for Pods and Containers* - Docs , PodQoS
[ 참고 Blog ]
- https://popappend.tistory.com/132
- https://blog.outsider.ne.kr/1653
- https://blog.naver.com/alice_k106/221676471427
- https://dev.to/danielepolencic/memory-requests-and-limits-in-kubernetes-40ep
- https://moozii-study.tistory.com/entry/쿠버네티스-14-파드-컴퓨팅-리소스
- https://littlemobs.com/blog/kuberentes-oom-kill-and-eviction/
[ 공식문서 ]
- Configure Default Memory Requests and Limits for a Namespace
- Configure Default CPU Requests and Limits for a Namespace
- Configure Minimum and Maximum Memory Constraints for a Namespace
- Configure Minimum and Maximum CPU Constraints for a Namespace
- Configure Memory and CPU Quotas for a Namespace
- Configure a Pod Quota for a Namespace
- Configure Quotas for API Objects
- Control CPU Management Policies on the Node - Task
- Control Topology Management Policies on a node - Task
[ 컨테이너 사용제한 설정 관련 ]
A. 자원 할당 제한 명령 확인
https://docs.docker.com/config/containers/resource_constraints/
https://docs.docker.com/engine/reference/run/#runtime-constraints-on-resources
# 컨테이너의 자원 제한을 변경 : update 명령어
kubeoff
docker update --help
..
Options:
      --blkio-weight uint16        Block IO (relative weight), between 10 and 1000, or 0 to disable (default 0)
      --cpu-period int             Limit CPU CFS (Completely Fair Scheduler) period
      --cpu-quota int              Limit CPU CFS (Completely Fair Scheduler) quota
      --cpu-rt-period int          Limit the CPU real-time period in microseconds
      --cpu-rt-runtime int         Limit the CPU real-time runtime in microseconds
  -c, --cpu-shares int             CPU shares (relative weight)
      --cpus decimal               Number of CPUs
      --cpuset-cpus string         CPUs in which to allow execution (0-3, 0,1)
      --cpuset-mems string         MEMs in which to allow execution (0-3, 0,1)
  -m, --memory bytes               Memory limit
      --memory-reservation bytes   Memory soft limit
      --memory-swap bytes          Swap limit equal to memory plus swap: -1 to enable unlimited swap
      --pids-limit int             Tune container pids limit (set -1 for unlimited)
      --restart string             Restart policy to apply when a container exits
B. Container Memory 사용 제한 : —memory 로 메모리 제한. m(megabyte), g(gigabyte) 단위, 제한할 수 있는 최소 메모리는 6MB
https://www.kernel.org/doc/gorman/html/understand/understand016.html : OOM
https://massive.io/ko/file-transfer/gb-vs-gib-whats-the-difference/ : GB vs GiB 차이

> Burstable 클래스의 포드가 메모리를 request보다 더 많이 사용하고 있다면 BestEffort 포드보다 먼저 종료될 수도 있다 → 확인해보자

> OOM Killer에 의해 프로세스가 종료될 경우 파드의 restartPolicy에 의해 컨테이너가 재시작됨

[ 참고 실습 코드 ]
# 아래 설정 후 oom_score 1328이며, 일반 파드 경우 1332
# https://raw.githubusercontent.com/kubernetes/website/main/content/en/examples/pods/resource/memory-request-limit.yaml
cat <<EOF | kubectl apply -f -
apiVersion: v1
kind: Pod
metadata:
  name: memory-demo
spec:
  terminationGracePeriodSeconds: 0
  containers:
  - name: memory-demo-ctr
    image: polinux/stress
    resources:
      requests:
        memory: "100Mi"
      limits:
        memory: "200Mi"
    command: ["stress"]
    args: ["--vm", "1", "--vm-bytes", "150M", "--vm-hang", "1"]
EOF

# 파드 정보 확인
kubectl describe pod memory-demo
...
Priority:         0
...
Containers:
  memory-demo-ctr:
    ...
    Limits:
      memory:  200Mi
    Requests:
      memory:     100Mi
...
QoS Class:                   Burstable
...

# 노드 정보 확인
kubectl describe node myk8s-control-plane
...
Non-terminated Pods:          (12 in total)
  Namespace                   Name                                           CPU Requests  CPU Limits  Memory Requests  Memory Limits  Age
  ---------                   ----                                           ------------  ----------  ---------------  -------------  ---
  default                     memory-demo                                    0 (0%)        0 (0%)      100Mi (0%)       200Mi (1%)     66m
  ...

Allocated resources:
  (Total limits may be over 100 percent, i.e., overcommitted.)
  Resource           Requests     Limits
  --------           --------     ------
  cpu                1350m (33%)  400m (10%)
  memory             1090Mi (6%)  1090Mi (6%)

#
ps -ef |grep stress
root       62498   62405  0 07:45 ?        00:00:00 stress --vm 1 --vm-bytes 150M --vm-hang 1

kubectl top pod memory-demo
NAME          CPU(cores)   MEMORY(bytes)
memory-demo   67m          150Mi

kubectl top nodes

#
docker exec -it myk8s-control-plane bash
----------------------------------------
#
crictl images
...

#
crictl ps
CONTAINER           IMAGE               CREATED             STATE               NAME                      ATTEMPT             POD ID              POD
56d557f0d8228       df58d15b053d1       45 minutes ago      Running             memory-demo-ctr           0                   b8b53659c305d       memory-demo

crictl ps --name memory-demo
crictl ps --name memory-demo -q

# 컨테이너 상세 정보 확인
crictl inspect $(crictl ps --name memory-demo -q) | jq
...

crictl inspect $(crictl ps --name memory-demo -q) | jq '.info.pid'
3064

## cgroupsPath 확인 : app 컨테이너
crictl inspect $(crictl ps --name memory-demo -q) | grep cgroupsPath
        "cgroupsPath": "kubelet-kubepods-burstable-pode771aed7_7262_4f57_be56_715c28b909e4.slice:cri-containerd:b36b3cdc3092a79da20d76b5cce0273fc550d4e3c64edb8f7195a698970807e0",

# QoS Class : Burstable
PID=3064
ls /proc/$PID/oom*
/proc/3064/oom_adj  /proc/3064/oom_score  /proc/3064/oom_score_adj

## oom_score_adj : OOM Score 조정값(-1000 ~ 1000)
## 참고로 oom_adj 도 조정값이고 Deprecated
cat /proc/$PID/oom_score_adj
994

## oom_score : 프로세스의 OOM Score
cat /proc/$PID/oom_score
1328


# (참고) QoS Class : Guaranteed - kindnet
kubectl describe pod -n kube-system -l app=kindnet
...
Priority:         0
...
Containers:
  kindnet-cni:
    ...
    Limits:
      cpu:     100m
      memory:  50Mi
    Requests:
      cpu:     100m
      memory:  50Mi
    ...
QoS Class:                   Guaranteed
Tolerations:                 op=Exists
                             node.kubernetes.io/disk-pressure:NoSchedule op=Exists
                             node.kubernetes.io/memory-pressure:NoSchedule op=Exists
                             node.kubernetes.io/network-unavailable:NoSchedule op=Exists
                             node.kubernetes.io/not-ready:NoExecute op=Exists
                             node.kubernetes.io/pid-pressure:NoSchedule op=Exists
                             node.kubernetes.io/unreachable:NoExecute op=Exists
                             node.kubernetes.io/unschedulable:NoSchedule op=Exists

crictl inspect $(crictl ps --name kindnet-cni -q) | jq '.info.pid'
PID=1050
cat /proc/$PID/oom_score_adj
-997
cat /proc/$PID/oom_score
3

# (참고) QoS Class : BestEffort , Priority Class Name(system-node-critical) - kube-proxy
## system-cluster-critical : Used for system critical pods that must run in the cluster, but can be moved to another node if necessary
kubectl get priorityclasses.scheduling.k8s.io
NAME                      VALUE        GLOBAL-DEFAULT   AGE
system-cluster-critical   2000000000   false            25h
system-node-critical      2000001000   false            25h

kubectl describe pod -n kube-system -l k8s-app=kube-proxy
Priority:             2000001000
Priority Class Name:  system-node-critical
...
QoS Class:                   BestEffort
Tolerations:                 op=Exists
                             node.kubernetes.io/disk-pressure:NoSchedule op=Exists
                             node.kubernetes.io/memory-pressure:NoSchedule op=Exists
                             node.kubernetes.io/network-unavailable:NoSchedule op=Exists
                             node.kubernetes.io/not-ready:NoExecute op=Exists
                             node.kubernetes.io/pid-pressure:NoSchedule op=Exists
                             node.kubernetes.io/unreachable:NoExecute op=Exists
                             node.kubernetes.io/unschedulable:NoSchedule op=Exists

crictl inspect $(crictl ps --name kube-proxy -q) | jq '.info.pid'
PID=887
cat /proc/$PID/oom_score_adj
-999
cat /proc/$PID/oom_score
2

# (참고) QoS Class : BestEffort - netshoot-pod
cat <<EOF | kubectl apply -f -
apiVersion: v1
kind: Pod
metadata:
  name: netpod
spec:
  containers:
  - name: netshoot-pod
    image: nicolaka/netshoot
    command: ["tail"]
    args: ["-f", "/dev/null"]
  terminationGracePeriodSeconds: 0
EOF

crictl inspect $(crictl ps --name netshoot-pod -q) | jq '.info.pid'
PID=3932250
cat /proc/$PID/oom_score_adj
1000
cat /proc/$PID/oom_score
1332

kubectl delete pod netpod


# cpu requests 별도 설정이 없을 경우, cpu_shares : "2" 적용됨
# memory 에 대한 보장 100Mi 관련 설정은 보이지 않고, 제한 200Mi 는 memory_limit_in_bytes 에서 확인
crictl inspect $(crictl ps --name memory-demo -q) | jq '.info.config.linux.resources'
{
  "cpu_period": 100000,
  "cpu_shares": 2,
  "memory_limit_in_bytes": 209715200,
  "oom_score_adj": 994,
  "hugepage_limits": [
    {
      "page_size": "2MB"
    },
    {
      "page_size": "1GB"
    }
  ],
  "unified": {
    "memory.oom.group": "1",
    "memory.swap.max": "0"
  }
}

# cpu requests 별도 설정이 없을 경우, cpu_shares : "2" 적용됨
crictl inspect $(crictl ps --name memory-demo -q) | jq '.info.runtimeSpec.linux.resources'
{
  "devices": [
    {
      "allow": false,
      "access": "rwm"
    }
  ],
  "memory": {
    "limit": 209715200,
    "swap": 209715200
  },
  "cpu": {
    "shares": 2,
    "period": 100000
..


# 컨테이너 로그 확인
crictl logs -f $(crictl ps --name memory-demo -q)
crictl logs $(crictl ps --name memory-demo -q)
stress: info: [1] dispatching hogs: 0 cpu, 0 io, 1 vm, 0 hdd

# 컨테이너 내부에서 실행
crictl exec -it $(crictl ps --name memory-demo -q) hostname
memory-demo

# List container(s) resource usage statistics : 150MiB 사용 확인
crictl stats
CONTAINER           NAME                      CPU %               MEM                 DISK                INODES
56d557f0d8228       memory-demo-ctr           6.97                157.9MB             32.77kB             9
...

crictl statsp
POD                                           POD ID              CPU %               MEM
memory-demo                                   b8b53659c305d       6.44                158.2MB
...

# Stream the events of containers
crictl event | jq
CTRL+C로 취소

## cgroupsPath 확인 : app 컨테이너
crictl inspect $(crictl ps --name memory-demo -q) | grep cgroupsPath
        "cgroupsPath": "kubelet-kubepods-burstable-pode771aed7_7262_4f57_be56_715c28b909e4.slice:cri-containerd:b36b3cdc3092a79da20d76b5cce0273fc550d4e3c64edb8f7195a698970807e0",

# (참고) cgroup 정보 확인
cd /sys/fs/cgroup/kubelet.slice/kubelet-kubepods.slice
ls -l
cd kubelet-kubepods-burstable.slice
ls -lt | head
total 0
-rw-r--r-- 1 root root 0 Aug  6 04:33 cgroup.subtree_control
drwxr-xr-x 4 root root 0 Aug  6 04:29 kubelet-kubepods-burstable-pod68bc6341_37d4_4cad_9ca3_6becd27dcec5.slice
...

cd kubelet-kubepods-burstable-pod68bc6341_37d4_4cad_9ca3_6becd27dcec5.slice
tree

## 각각 pause 컨테이너와 app 컨테이너
ls -l | grep cri
drwxr-xr-x 2 root root 0 Aug  6 04:29 cri-containerd-0694f12685ad1a903637f1439c9b5d97d764b8a8aeb830237405bd69760d0456.scope
drwxr-xr-x 2 root root 0 Aug  6 04:29 cri-containerd-929f7894938b2bdc26dbdef0296216b8498812924354959c084c63fdc90244cb.scope

cd cri-containerd-929f7894938b2bdc26dbdef0296216b8498812924354959c084c63fdc90244cb.scope

## 현재 메모리 사용량 확인
cat memory.current
157937664

## 최대 메모리 사용 가능량 확인
cat memory.max
209715200

## 메모리 이벤트
cat memory.events
low 0
high 0
max 0
oom 0
oom_kill 0
oom_group_kill 0

## 메모리 사용량
cat memory.stat
...

## CPU 사용량 확인
### usage_usec: 이 cgroup이 사용한 총 CPU 시간(마이크로초)입니다.
### user_usec: 사용자 모드에서 사용한 총 CPU 시간(마이크로초)입니다.
### system_usec: 커널 모드에서 사용한 총 CPU 시간(마이크로초)입니다.
### nr_periods: 주기의 수 (CPU 접근 가능 기간).
### nr_throttled: 제한된 횟수.
### throttled_usec: 제한된 총 시간(마이크로초).
cat cpu.stat
usage_usec 46113983
user_usec 5871223
system_usec 40242760
core_sched.force_idle_usec 0
nr_periods 0
nr_throttled 0
throttled_usec 0
nr_bursts 0
burst_usec 0


# (참고) pods, inspectp 명령어
crictl pods
crictl pods --name memory-demo -v
crictl pods --name memory-demo
crictl pods --name memory-demo -q
crictl inspectp $(crictl pods --name memory-demo -q) | jq
crictl inspectp $(crictl pods --name memory-demo -q) | jq '.info'
crictl inspectp $(crictl pods --name memory-demo -q) | jq '.info.config.linux'
crictl inspectp $(crictl pods --name memory-demo -q) | jq '.info.runtimeSpec.annotations'
crictl inspectp $(crictl pods --name memory-demo -q) | jq '.info.runtimeSpec.linux.resources'

# 빠져나오기
exit
----------------------------------------

# 다음 실습을 위해 파드 종료
kubectl delete pod memory-demo
- Exceed a Container's memory limit : 제한 보다 파드가 메모리 사용이 높을 경우 - Task / OOM_Killer
# [터미널1] 파드 리소스 모니터링
docker exec -it myk8s-control-plane crictl statsp -w

# [터미널2] 파드 리소스 모니터링
docker exec -it myk8s-control-plane crictl event | jq
...
  "containersStatuses": [
    {
      "id": "74f8831cb3b38bde362136dfca0dde7861d21f5128bfdd630b27458e40988d84",
      "metadata": {
        "name": "memory-demo-2-ctr",
        "attempt": 4
      },
      "state": "CONTAINER_EXITED",
      "createdAt": "1722850375307786571",
      "startedAt": "1722850375400103448",
      "finishedAt": "1722850375461524547",
      "exitCode": 137,
      "image": {
        "image": "docker.io/polinux/stress:latest",
        "annotations": {},
        "userSpecifiedImage": "",
        "runtimeHandler": ""
      },
      "imageRef": "docker.io/polinux/stress@sha256:b6144f84f9c15dac80deb48d3a646b55c7043ab1d83ea0a697c09097aaad21aa",
      "reason": "OOMKilled",
      "message": "",
...

# [터미널3] 파드 생성
cat <<EOF | kubectl apply -f -
apiVersion: v1
kind: Pod
metadata:
  name: memory-demo-2
spec:
  terminationGracePeriodSeconds: 0
  containers:
  - name: memory-demo-2-ctr
    image: polinux/stress
    resources:
      requests:
        memory: "50Mi"
      limits:
        memory: "100Mi"
    command: ["stress"]
    args: ["--vm", "1", "--vm-bytes", "250M", "--vm-hang", "1"]
EOF

#
kubectl get pod -w
NAME            READY   STATUS             RESTARTS      AGE
memory-demo-2   0/1     CrashLoopBackOff   1 (15s ago)   19s
memory-demo-2   0/1     OOMKilled          2 (17s ago)   21s
memory-demo-2   0/1     CrashLoopBackOff   2 (12s ago)   32s
memory-demo-2   0/1     OOMKilled          3 (28s ago)   48s
...

#
kubectl describe pod memory-demo-2
...
    State:          Waiting
      Reason:       CrashLoopBackOff
    Last State:     Terminated
      Reason:       OOMKilled
      Exit Code:    137
      Started:      Mon, 05 Aug 2024 09:05:24 +0000
      Finished:     Mon, 05 Aug 2024 09:05:24 +0000
    Ready:          False
    Restart Count:  3
    Limits:
      memory:  100Mi
    Requests:
      memory:     50Mi
...

#
kubectl get pod memory-demo-2 -o yaml
...
  containerStatuses:
  - containerID: containerd://cf4759990d92c3fcf248932ed63ddcfbe3adfcbdbd08eb451bcd24ad28fe5c15
    image: docker.io/polinux/stress:latest
    imageID: docker.io/polinux/stress@sha256:b6144f84f9c15dac80deb48d3a646b55c7043ab1d83ea0a697c09097aaad21aa
    lastState:
      terminated:
        containerID: containerd://cf4759990d92c3fcf248932ed63ddcfbe3adfcbdbd08eb451bcd24ad28fe5c15
        exitCode: 137
        finishedAt: "2024-08-05T09:06:16Z"
        reason: OOMKilled
        startedAt: "2024-08-05T09:06:16Z"
...

# 다음 실습을 위해 파드 종료
kubectl delete pod memory-demo-2- Specify a memory request that is too big for your Nodes : 노드의 여유 메모리 보다 큰 파드의 메모리 요청 시 - Task
# 파드 생성
cat <<EOF | kubectl apply -f -
apiVersion: v1
kind: Pod
metadata:
  name: memory-demo-3
spec:
  terminationGracePeriodSeconds: 0
  containers:
  - name: memory-demo-3-ctr
    image: polinux/stress
    resources:
      requests:
        memory: "1000Gi"
      limits:
        memory: "1000Gi"
    command: ["stress"]
    args: ["--vm", "1", "--vm-bytes", "150M", "--vm-hang", "1"]
EOF

#
kubectl get pod
NAME            READY   STATUS    RESTARTS   AGE
memory-demo-3   0/1     Pending   0          5s

#
kubectl describe pod memory-demo-3 | grep Events: -A100
Events:
  Type     Reason            Age   From               Message
  ----     ------            ----  ----               -------
  Warning  FailedScheduling  57s   default-scheduler  0/1 nodes are available: 1 Insufficient memory. preemption: 0/1 nodes are available: 1 No preemption victims found for incoming pod.

# 다음 실습을 위해 파드 종료
kubectl delete pod memory-demo-3- CPU 제한 보다 파드가 CPU 요구 사용을 높게 설정 시 : Memory 와 다르게 CPU는 압축 가능한 자원으로 Throttled 발생 - Blog KrBlog
- CPU는 "압축 가능한" 리소스로 간주됩니다. 앱이 CPU 제한에 도달하기 시작하면 Kubernetes가 컨테이너를 제한하기 시작하여 앱의 성능이 잠재적으로 저하됩니다. 그러나 종료되지 않습니다. 이것이 "압축 가능한"의 의미입니다.
- CPU is considered a "compressible" resource. If your app starts hitting your CPU limits, Kubernetes starts throttling your container, giving your app potentially worse performance. However, it won’t be terminated. That is what "compressible" means.
- CPU와는 다르게 (cgroup v1에서) 메모리를 압축할 수 없습니다. 메모리 사용량을 조절할 방법이 없기 때문에 컨테이너가 메모리 제한을 초과하면 커널에서 OOM(메모리 부족) 종료로 종료됩니다.
- Furthermore, memory actually can't be compressed in cgroup v1. Because there is no way to throttle memory usage, if a container goes past its memory limit it will be terminated by the kernel with an OOM (Out of Memory) kill.
- OOM Killer 종류 : cgroup OOM Killer , Global OOM Killer(kubelet 레벨의 OOM, OS 레벨의 OOM) - KrBlog
- CPU는 "압축 가능한" 리소스로 간주됩니다. 앱이 CPU 제한에 도달하기 시작하면 Kubernetes가 컨테이너를 제한하기 시작하여 앱의 성능이 잠재적으로 저하됩니다. 그러나 종료되지 않습니다. 이것이 "압축 가능한"의 의미입니다.
☞ kind k8s 컨테이너 CPU/Mem 리소스 제한 설정
# 기본 설정 확인 : CPU/Mem 리소스 제한 없음
docker inspect myk8s-control-plane | egrep -i 'cpu'
            "CpuShares": 0,
            "NanoCpus": 0,
            "CpuPeriod": 0,
            "CpuQuota": 0,
            "CpuRealtimePeriod": 0,
            "CpuRealtimeRuntime": 0,
            "CpusetCpus": "",
            "CpusetMems": "",
            "CpuCount": 0,
            "CpuPercent": 0,

docker inspect myk8s-control-plane | egrep 'Memory|Oom|OOM|Swap'
            "OOMKilled": true,
            "OomScoreAdj": 0,
            "Memory": 0,
            "MemoryReservation": 0,
            "MemorySwap": 0,
            "MemorySwappiness": null,
            "OomKillDisable": null,

#
# docker update --memory="8g" --memory-swap 0 --cpus="3" myk8s-control-plane
docker update --memory="8g" --memory-swap 8589934592 --cpus="3" myk8s-control-plane

#
docker inspect myk8s-control-plane | egrep -i 'cpu'
            "CpuShares": 0,
            "NanoCpus": 3000000000,
            "CpuPeriod": 0,
            "CpuQuota": 0,
            "CpuRealtimePeriod": 0,
            "CpuRealtimeRuntime": 0,
            "CpusetCpus": "",
            "CpusetMems": "",
            "CpuCount": 0,
            "CpuPercent": 0,

docker inspect myk8s-control-plane | egrep 'Memory|Oom|OOM|Swap'
            "OOMKilled": true,
            "OomScoreAdj": 0,
            "Memory": 8589934592,
            "MemoryReservation": 0,
            "MemorySwap": 8589934592,
            "MemorySwappiness": null,
            "OomKillDisable": null,

# (참고) 혹시 모르니, 컨테이너 중지 후 재시작
docker stop myk8s-control-plane
docker start myk8s-control-plane

# 메모리 16GiB로 출력
docker exec -it myk8s-control-plane free -h
               total        used        free      shared  buff/cache   available
Mem:            15Gi       1.1Gi       7.1Gi        11Mi       7.7Gi        14Gi
Swap:          4.0Gi       3.5Mi       4.0Gi

# CPU 4로 출력
docker exec -it myk8s-control-plane htop
4) Learn k8s
'AEWS' 카테고리의 다른 글
| AEWS 7주차 - EKS Mode/Nodes (Fargate, Auto-mode) (0) | 2025.03.17 |
|---|---|
| AEWS - 6주차 EKS Security (1) | 2025.03.11 |
| AEWS 4주차 - EKS Observability (0) | 2025.02.24 |
| AEWS 3주차 - EKS Storage, Managed Node Groups (1) | 2025.02.17 |
| AEWS 2주차 - EKS Networking (0) | 2025.02.11 |


